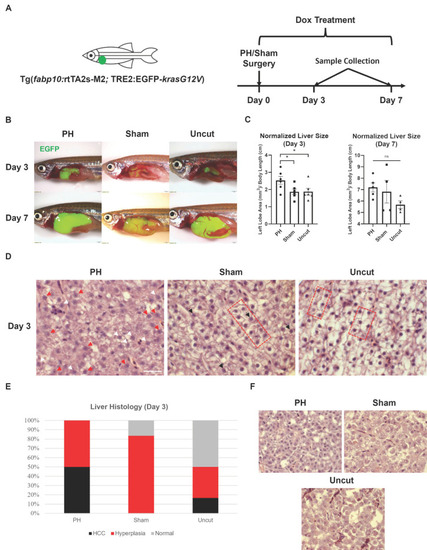
Effects of PH on the krasG12V-induced development of HCC in zebrafish. (A) Schedule of surgeries and Dox treatment in the experiment. Right after PH or sham surgery, kras+ male zebrafish were exposed to 20 mg/L Dox to induce the overexpression of oncogene krasG12V in the liver. (B) Representative photos of PH/sham surgery-treated kras+ zebrafish 3 days and 7 days after Dox induction. (C) Measurement and comparison of the 2D area of the kras+ livers in mm2 based on (B) after being normalized with the body length in cm (n ≥ 4). Circles, squares, and triangles indicate values of individual samples. (D) Representative H&E staining images of the PH/sham surgery-treated kras+ zebrafish livers 3 days after Dox induction (n = 6). Examples of morphology associated with HCC and hyperplasia are indicated with symbols. Red arrowheads: irregular nuclei with prominent nucleoli; white arrowheads: nuclei with multiple nucleoli; black arrowheads: enlarged nuclei with prominent nucleoli; red bracket: two-cell hepatocyte plate structures. (E) Quantification of HCC histology observed in kras+ zebrafish from each treatment group on Day 3 based on (D). (F) Representative H&E staining images of the PH/sham surgery-treated kras+ zebrafish livers 7 days after Dox induction (n = 6). Scale Bar = (B) 1 mm and (D,F) 20 μm. ns p > 0.05, * p ≤ 0.05.
|
