
Fig. 2
- ID
- ZDB-FIG-240521-41
- Publication
- Kudoh et al., 2024 - Genomic screening of fish-specific genes in gnathostomes and their functions in fin development
- Other Figures
- All Figure Page
- Back to All Figure Page
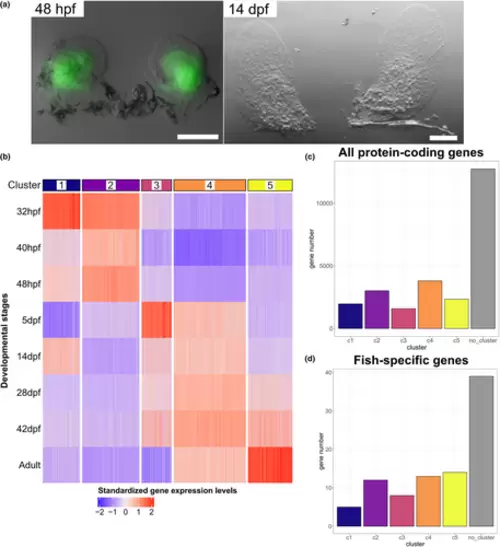
RNA-seq analysis of developing pectoral fins. (a) Excised pectoral fins at 48 hpf (left) and 14 dpf (right). Fin mesenchyme in 48 hpf samples was labeled with EGFP (gt1116A), which confirmed that the entire fin bud region was excised. Scale bars: 100 μm. (b) Heatmap showing clusters based on expression fluctuation, representing expression of 12,699 clustered genes out of 25,432 protein-coding genes. The vertical axis indicates developmental stage. (c, d) The numbers of all zebrafish genes (c) and fish-specific genes (d) that were included in each cluster. The color of the bar corresponds to that of each cluster in (b). “no_cluster” indicates genes that were not assigned to any clusters. |