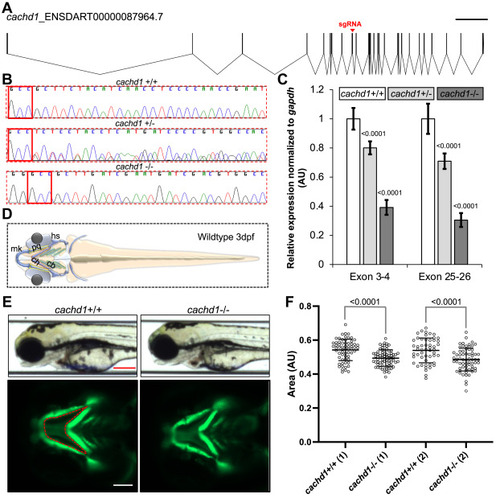
Ablation of zebrafish cachd1 by CRISPR-Cas9 results in craniofacial abnormalities. A. Schematic of zebrafish cachd1 transcript (GRCz11, Ensembl transcript ID: ENSDART00000087964.7) generated by Exon-Intron Graphic Maker (http://wormweb.org/exonintron). The sgRNA target site on exon 9 is indicated by a red triangle. Scale bar, 10 kb. B. Representative sequence chromatograms of cachd1 +/+ (wild type), cachd1+/− (heterozygous mutant), and cachd1−/− (homozygous mutant) are shown. Protospacer adjacent motif (PAM) is indicated by a red box for each chromatogram. Mutants harbor a 16 bp deletion (19 bp deletion and 3 bp insertion) that results in a frameshift and putative protein truncation (p.Phe452LeufsTer3). C. Bar graph showing relative mRNA expression of cachd1 in genotype-matched 2 day post-fertilization (dpf) larvae generated from F1 in-crosses. n = 20 per batch, 3 technical replicates per experiment, 8 biological replicates (One way ANOVA; Tukey’s multiple comparisons test). Tails were used for genotyping, whereas RNA was extracted from the matched heads for quantitative PCR analysis. Relative expression was normalized to gapdh, and statistical differences were calculated using One way ANOVA (F [5, 42] = 50.39; P value < .0001]; Tukey’s multiple comparisons test’s P values for mutants versus +/+ are indicated above each bar. Error bars represent standard error of the mean. D. Schematic of 3 dpf zebrafish larva showing a ventral view of craniofacial cartilage structures. Abbreviations: Meckel’s cartilage (mk, blue), palatoquadrate (pq, yellow), ceratohyal (ch, orange), hyosymplectic (hs, gray), and ceratobranchial (cb, green). E. Representative images of −1.4col1a1:egfp;cachd1 larvae imaged live at 3 dpf. Top: bright field lateral images of wild-type and homozygous mutants. Scale bar, 200 μm. Bottom: fluorescent ventral images of wild-type and homozygous mutants. Region of interest (ROI) area, as outlined in red and bordered by ch, pq, and mk, was measured to detect statistical differences. Scale bar, 100 μm. F. Quantification of ROI indicated in (E); AU, arbitrary units. Statistical differences were calculated using an unpaired t test (n = 50-70 larvae per condition, repeated). Biological replicates (1 and 2 as indicated in x axis labels) were obtained from different parental pairs with the investigator masked to the experimental conditions. Regardless of their parental genotype, all embryos obtained were morphologically similar,and no animal was excluded from imaging and quantification. Error bars represent standard deviation of the mean.
|

