|
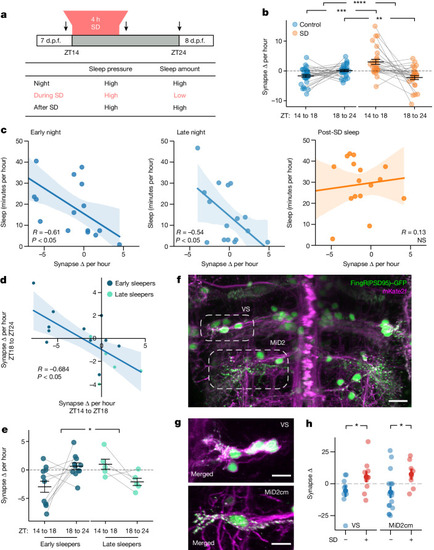
Synapse counts of neurons are modulated by sleep and SD. a, The 4 h gentle handling SD paradigm (ZT14–ZT18). Larvae were video-tracked and neurons were periodically imaged (arrows). b, The mean ± s.e.m. change in synapse counts per hour for the SD (orange, n = 31 neurons) and control (blue, n = 28) groups. c, Sleep time versus the change in synapse counts per hour for each larva during either the early (ZT14–ZT18, left) or late (ZT18–ZT24, middle) night for controls and after SD (ZT18–ZT24, right). The rate of synapse change is negatively correlated with sleep time during both early and late night but not after SD. d, In control larvae, the change in early night synapse counts is negatively correlated with late night synapse change. Early and late sleepers are defined as larvae that either sleep more in the first or second phase of the night, respectively. e, Synapse counts per hour for early- and late-night sleeping control larvae in the early (ZT14–ZT18) and late (ZT18–ZT24) phases of the night. Data are mean ± s.e.m. f–h, The reticulospinal neuron synapse number is modulated by sleep and wake states. f, Example reticulospinal neurons from the Tg(pvalb6:KALTA4)u508 line co-labelled by FingR(PSD95)–GFP (green, nuclei and synapses) and mKate2f (magenta, membrane). Vestibulospinal (VS) and MiD2cm neurons are indicated by the dashed ovals. g, Vestibulospinal (top) and MiD2cm (bottom) neurons from different larvae showing FingR(PSD95)+ synapses (green) co-localized to the cell membrane (magenta). h, Changes in synapse number (mean and 68% CI) from ZT14 to ZT18 for vestibulospinal and MiD2cm neurons. Each dot represents the average across multiple neurons per larva. For b and e, statistical analysis was performed using two-tailed mixed ANOVA interaction (condition × time) with post hoc Benjamini–Hochberg correction; ****P = 0.00007, ***P = 0.0002 and **P = 0.006 (b) and *P = 0.01 (e). For h, statistical analysis was performed using one-tailed Student’s t-tests; *P < 0.03. Scale bars, 15 μm (f) and 10 μm (g). The lines in c and d depict the linear regression with the 95% CI. Source Data
|