
Fig. 1
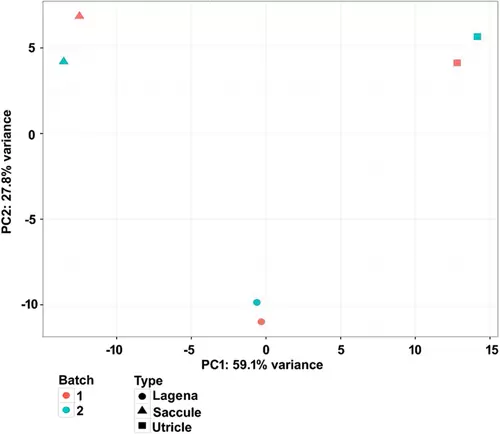
PCA of microarray expression levels across three different otolith organs in zebrafish. The x-axis represents the greatest source of variance across all samples and the y-axis represents the second greatest. Each symbol represents the results of one microarray hybridization, as indicated in the legend. Red symbols represent RNA samples from the first batch and blue symbols represent RNA samples from the second batch. Six samples are well grouped by different otolith organs, indicating that there is less variance between samples of the same otolith organs than between two different batches. The two greatest principal components account for 86.9% (59.1% + 27.8%) of the variance. |