
FIGURE
Fig. 8
Fig. 8
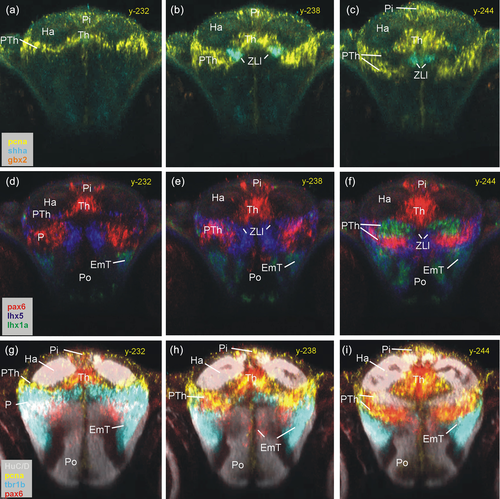
Rostral thalamic and prethalamic zebrafish gene expression. Three series of identical consecutive transverse sections characterize most rostral thalamic levels using proliferative cells (pcna) and ZLI (shha) (a–c), some transcription factors (pax6a, lhx5, and lhx1a) (d–f), and demonstrate separation of PTh from EmT using tbr1b (g-i; see text). EmT, eminentia thalami; Ha, habenula; P, pallium; Pi, pineal; Po, preoptic area; PTh, prethalamus; Th, thalamus; ZLI, zona limitans intrathalamica. |
Expression Data
Expression Detail
Antibody Labeling
Phenotype Data
Phenotype Detail
Acknowledgments
This image is the copyrighted work of the attributed author or publisher, and
ZFIN has permission only to display this image to its users.
Additional permissions should be obtained from the applicable author or publisher of the image.
Full text @ J. Comp. Neurol.