|
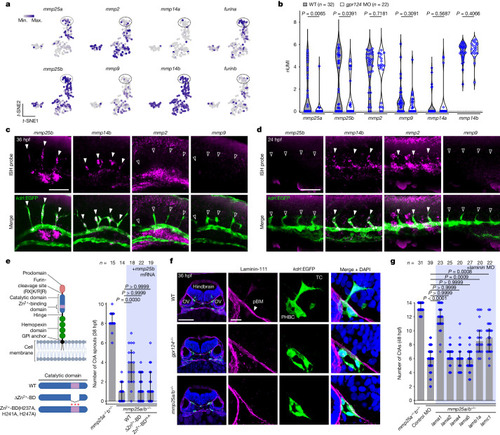
TCs require a specialized MMP repertoire to migrate across the pial basement membrane. a, t-SNE expression profiles of mmp and furin genes. b, Expression levels of mmp genes in WT and gpr124-MO PHBC ECs. Dots represent individual cells. nUMI, normalized unique molecular identifier. P values were calculated using parametric two-tailed Student’s t-tests. c,d, Fluorescent mmp25b, mmp14b, mmp2 or mmp9 WISH and anti-EGFP staining of Tg(kdrl:EGFP) embryos in the hindbrain (c) and trunk region (d). The solid and open arrowheads label mmp-positive and -negative sprouts, respectively. e, CtA sprouts in 38 hpf Tg(kdrl:EGFP) embryos (n ≥ 14 embryos from ≥3 independent experiments), injected at the one-cell stage with 200 pg of mmp25b mRNA or its variants (left). BD, binding domain; H-A, H237A, H241A, H247A. The diagram was created using BioRender. f, Anti-laminin-111 immunofluorescence staining of transverse hindbrain sections, counterstained with DAPI. OV, otic vesicle. g, Hindbrain CtAs in Tg(kdrl:EGFP) embryos (n ≥ 20 embryos from ≥3 independent experiments) injected with control or laminin MOs. In e and g, data are median ± interquartile range. P values were calculated using nonparametric Kruskal–Wallis tests. Scale bars, 100 μm (f (left)), 50 μm (c and d) and 10 μm (f (right)). Source Data
|