
Fig. 2
- ID
- ZDB-FIG-240418-3
- Publication
- Sone et al., 2024 - Efficient detection of single nucleotide variants in targeted genomic loci
- Other Figures
- All Figure Page
- Back to All Figure Page
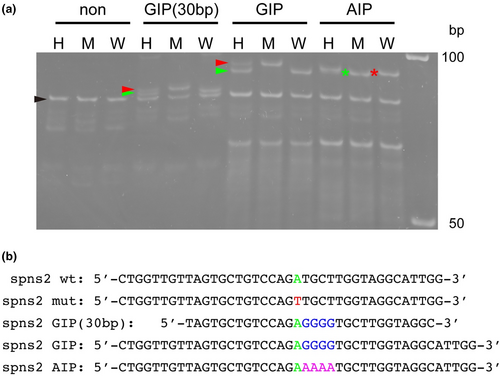
Detection of single nucleotide differences at the spns2 locus by GIMA. (a) Genotyping of the spns2 locus using GIMA. H, heterozygous alleles; M, homozygous mutant alleles; W, homozygous wild-type alleles. The black arrowhead indicates the position of the PCR amplicons (heterozygous, homozygous mutant, and homozygous wild-type bands). The red arrowheads indicate the position of the GIP–mutant or GIP (30 bp)–mutant complex. The green arrowheads indicate the position of the GIP–wild-type or GIP (30 bp)–wild-type complex. The red asterisk and green asterisk indicate the positions of the AIP–mutant and the AIP–wild-type complex, respectively. The molecular marker is indicated on the right. Essentially similar results were obtained from at least three independent experiments. (b) Nucleotide sequences of the wild-type spns2 sense strand, the mutant spns2 sense strand, GIP, and AIP are shown. Green, wild-type nucleotide site; red, mutant nucleotide site; blue, inserted guanine nucleotides; pink, inserted adenine nucleotides. |