
FIGURE
Fig. 6
- ID
- ZDB-FIG-240417-27
- Publication
- Sharma et al., 2023 - Novel Development of Magnetic Resonance Imaging to Quantify the Structural Anatomic Growth of Diverse Organs in Adult and Mutant Zebrafish
- Other Figures
- All Figure Page
- Back to All Figure Page
Fig. 6
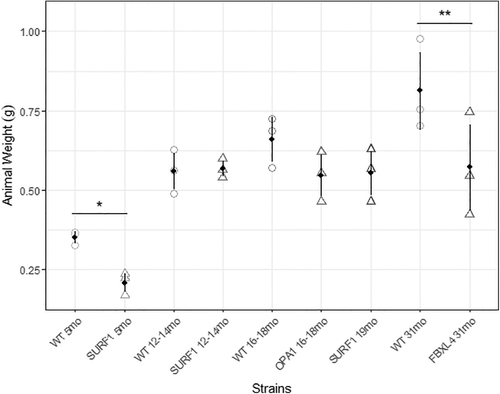
. Comparison of animal weight in three mitochondrial disease mutants (triangles) versus age-matched WT (circles) adult zebrafish. From left to right, 5-month-old WT, 5-month-old surf1−/− mutants; 12–14-month-old WT, 12–14-month-old surf1−/− mutants; 16–18-month-old WT, 16–18-month-old opa1+/− mutants, 19-month-old surf1−/− mutants; 31-month-old WT, 31-month-old fbxl4−/− mutant zebrafish. *p < 0.05, **p < 0.01. |
Expression Data
Expression Detail
Antibody Labeling
Phenotype Data
| Fish: | |
|---|---|
| Observed In: | |
| Stage: | Adult |
Phenotype Detail
Acknowledgments
This image is the copyrighted work of the attributed author or publisher, and
ZFIN has permission only to display this image to its users.
Additional permissions should be obtained from the applicable author or publisher of the image.
Full text @ Zebrafish