
Fig. 2
- ID
- ZDB-FIG-240405-107
- Publication
- Weinberger et al., 2024 - Distinct epicardial gene regulatory programs drive development and regeneration of the zebrafish heart
- Other Figures
- All Figure Page
- Back to All Figure Page
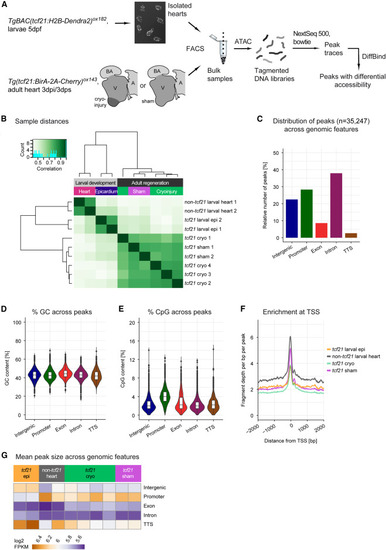
Chromatin accessibility in the developing and regenerating zebrafish epicardia (A) Overview of the ATAC sequencing workflow. (B) Distance-based clustering of the Pearson correlations of larval and adult accessible chromatin profiles, as indicated by the dendrogram. Correlation values are indicated by color. (C–E) Relative quantification of peak distribution across genomic features (C), peak GC content (D), and peak CpG content (E). (F) Average relative sequencing read densities at TSSs. (G) Average peak size across genomic features. dpf, days post fertilization; dpi, days post-injury; V, ventricle; A, atrium; BA, bulbus arteriosus; bp, base pairs. Number of biological replicates analyzed: tcf21 larval epi, n = 2; non-tcf21 larval heart, n = 2; tcf21 cryo, n = 4; tcf21 sham, n = 2. In D,E, box and whiskers plots (in the style of Tukey) indicate median and first/third quartiles. |
Reprinted from Developmental Cell, 59(3), Weinberger, M., Simões, F.C., Gungoosingh, T., Sauka-Spengler, T., Riley, P.R., Distinct epicardial gene regulatory programs drive development and regeneration of the zebrafish heart, 351-367.e6, Copyright (2024) with permission from Elsevier. Full text @ Dev. Cell