
Fig. 2
- ID
- ZDB-FIG-240328-90
- Publication
- Lazzaroni et al., 2023 - Circulating biomarkers in familial cerebral cavernous malformation
- Other Figures
- All Figure Page
- Back to All Figure Page
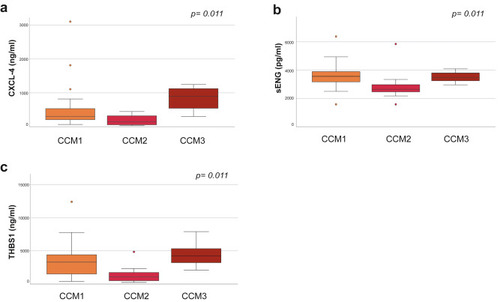
Expression levels of biomarkers to stratify patients according to genotype. Box and whisker plots (box represent the interquartile range and outliers are 1.5 box lengths from median) of the concentrations of plasma CXCL4 (a), sENG (b) and THBS1 (c) markers for each fCCM genetic group (n = 3 technical replicates). The central black lines show the median values, regions above and below these lines show the upper and lower quartiles, respectively. CCM1 is represented by orange box, CCM2 by light red and CCM3 by dark red boxes. The p-values were calculated by means of Kruskall–Wallis test and account for false discovery rate. CXCL4, chemokine (C-X-C motif) ligand 4; sENG, soluble endogline; THBS1, thrombospondin1. |