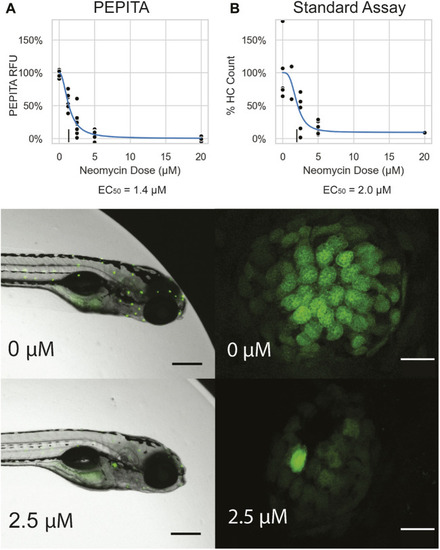
Characterization of single drug dose response with PEPITA. (A) Images and quantification of neomycin dose response from a representative experiment, using PEPITA (A) and the standard approach of counting HCs from individual neuromasts (B). All fish featured in this figure were treated and characterized in the same experiment. Top: dose-response curve generated by the PEPITA workflow with relative fluorescence units (RFU) (EC50 = 1.4 μM, left) shows similar properties to the dose response curve derived by enumerating normalized HC counts from individual neuromasts using procedure described in Section 2.3 (EC50 = 2.0 μM, right). (A) middle: representative image of a fish exposed to no drug, which is used for PEPITA quantification; (B) middle: representative image of an individual neuromast from a fish that was exposed to no drug, used for HC counting. (A) bottom: representative image of a fish exposed to 2.5 μM NEO, which is used for PEPITA quantification; (B) bottom: representative image of an individual neuromast from a fish that was exposed to 2.5 μM NEO, used for HC counting. Note that PEPITA uses the image of the whole fish for quantification, whereas the images have been cropped in these panels to faciliate visual inspection of the stained neuromasts. Scale bars in fish images represent 300 μm, and scale bars in neuromast images represent 10 μm.
|
