
FIGURE
Fig. 4.
- ID
- ZDB-FIG-240311-22
- Publication
- Del Rosario Hernández et al., 2024 - Drug repurposing for neurodegenerative diseases using Zebrafish behavioral profiles
- Other Figures
- All Figure Page
- Back to All Figure Page
Fig. 4.
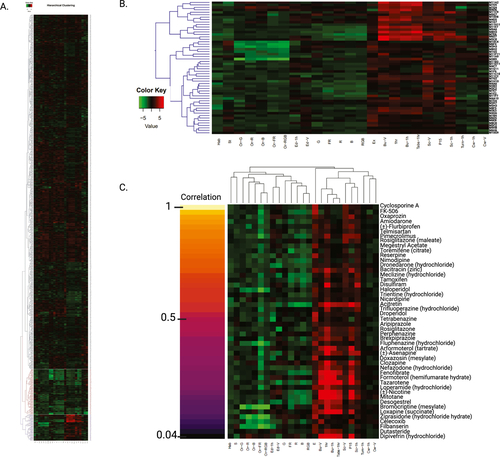
Hierarchical cluster analysis. |
Expression Data
Expression Detail
Antibody Labeling
Phenotype Data
Phenotype Detail
Acknowledgments
This image is the copyrighted work of the attributed author or publisher, and
ZFIN has permission only to display this image to its users.
Additional permissions should be obtained from the applicable author or publisher of the image.
Full text @ Biomed. Pharmacother.