|
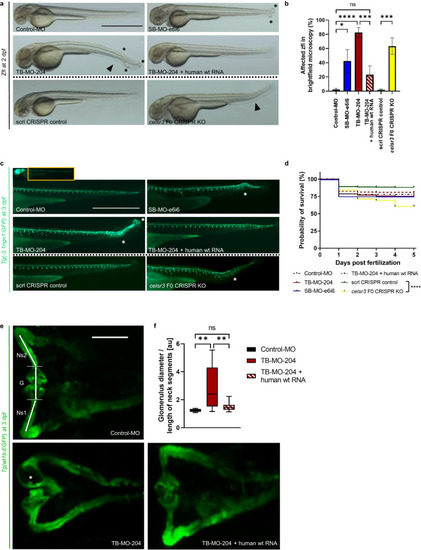
Transient suppression of Celsr3 in zebrafish larvae. Phenotypic evaluation of the different zebrafish larvae (zfl) groups: Zfl injected with Control-Morpholino (Control-MO), zfl injected with MO blocking celsr3 splice site exon 6 – intron 6 (SB-MO-e6i6), zfl injected with MO blocking transcript celsr3-204 (TB-MO-204), zfl co-injected with TB-MO-204 and human wild-type (wt) CELSR3 polyA mRNA, zfl injected with scrambled (scrl) CRISPR control and celsr3 F0 CRISPR knockout (KO) mixes. a Representative brightfield microscopy of laterally mounted zfl at two days post fertilization (dpf) treated with 1-phenyl 2-thiourea (PTU). Asterisks: Example caudal end disruption. Arrowhead: Example warped tail. Scale bar 1000 µm. b Percentage of affected zfl in brightfield microscopy. TB-MO-204 injected zfl and celsr3 F0 CRISPR KO zfl show highly significant affection of a warped tail and/or caudal end disruption. In most zfl exposed to TB-MO-204 the phenotype could be rescued with human wt polyA CELSR3 mRNA. Number (n) of zfl for each injection group: Control-MO (n = 157), SB-MO-e6i6 (n = 278), TB-MO-204 (n = 223), TB-MO-204 + human wt RNA (n = 221), scrl CRISPR control (n = 416) and celsr3 F0 CRISPR KO (n = 440). Number of independent experiments N = 3 for both MO and CRISPR. c Representative laterally mounted Tg(-3.1ngn1:GFP) zfl at three dpf treated with PTU and imaged from lateral to visualize the effect of Celsr3 MO knockdown (MO-KD) or F0 celsr3 KO on neurogenesis. The structural irregularities at the caudal end of the MO-KD or F0 celsr3 KO zfl correlate with a disruption of the neuronal arrangement (white asterisks). Scale bar 1000 µm. d Kaplan–Meier plot showing a comparable survival rate for each respective injection group. Number (n) of zf embryos for each injection group: Control-MO (n = 203), SB-MO-e6i6 (n = 367), TB-MO-204 (n = 290), TB-MO-204 + human wt RNA (n = 272), scrl CRISPR control (n = 469) and celsr3 F0 CRISPR KO (n = 611). Number of independent experiments N = 3 each. e Representative dorsally mounted Tg(wt1b:EGFP) zfl at three dpf treated with PTU and imaged from dorsal to visualize the effect of Celsr3 MO-KD on the development of the pronephros. White asterisk: Example enlarged glomerulus. G: Glomerulus. Ns1: Right neck segment. Ns2: Left neck segment. Scale bar 100 µm. f Box plot showing the size of the glomerulus in relation to the neck segments (G/((Ns1 + Ns2)/2)) calculated for each Tg(wt1b:EGFP) zfl at three dpf. MO-injected zfl show a highly significant increase of the glomerular diameter in comparison to the length of the neck segments. This effect was almost completely rescued when TB-MO-204 was co-injected together with human CELSR3 wt polyA mRNA. Control-MO (n = 22), TB-MO-204 (n = 27), TB-MO-204 + human wt RNA (n = 29). Number of independent experiments N = 3. *p-value < 0.05, **p-value < 0.01, ***p-value < 0.001, ****p-value < 0.0001, ns not significant. Two-way ANOVA. Mean: SEM.
|