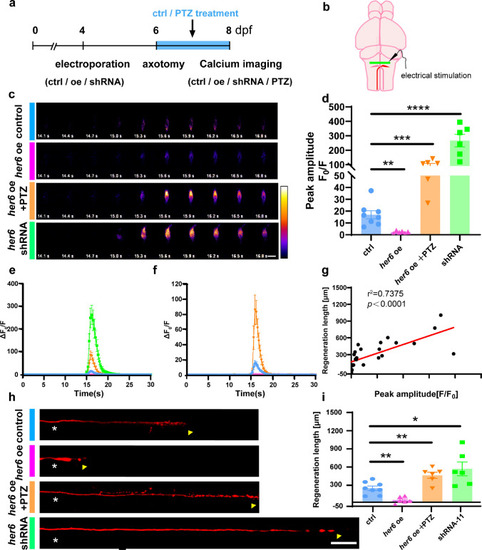
Her6 regulates calcium activity in M-cells and affects axon regeneration in vivo.a The time axis showed the time-points of electroporation, axotomy, dynamic calcium imaging, and regeneration imaging. One of the pharmacological-treated groups was treated with PTZ for 48 h after injury and then imaging of calcium activity and regeneration was performed. b Diagram of the brain of zebrafish and the location of electrical stimulation in M-cells. c Representative examples of M-cell calcium activity after electrical stimulation in larvae labeled with NEMOf. The time after the stimulation (in seconds) is given in each frame. The color scale indicates fluorescence intensity (black: lowest; white: highest; Scale bar, 20 μm). d The peak amplitude of the calcium response traces in larvae that regulate her6 expression by plasmid or pharmacologically (control: 16.96 ± 3.388, n = 8 fish; her6 oe: 2.108 ± 0.4145, n = 6 fish; her6 shRNA-11: 266 ± 43.45, n = 6 fish; her6 oe + PTZ: 457.3 ± 51, n = 6 fish). Assessed by one-way ANOVA. e, f The calcium response elicited in larvae overexpressing her6 was much weaker than that in control larvae and the response elicited in larvae her6 shRNA was much stronger than that in control larvae. g The relationship between regeneration length and peak amplitude of calcium response has a significant positive correlation (r2 = 0.7375, n = 26). h, i Altered her6 expression affects M-cells axon regeneration (control: 241.5 ± 36.38 μm, n = 8 fish; her6 oe: 44.38 ± 21.65 μm, n = 6 fish; her6 shRNA-11: 563.3 ± 114.2 μm, n = 6 fish; her6 oe + PTZ: 457.3 ± 51 μm, n = 6 fish). White asterisk: ablation point; arrowhead, axon regeneration terminal. scale bar, 50 μm. Assessed by one-way ANOVA
|
