
Fig. 2
- ID
- ZDB-FIG-240229-14
- Publication
- Cheng et al., 2023 - Actin-mediated endocytosis in the E-YSL helps drive epiboly in zebrafish
- Other Figures
- All Figure Page
- Back to All Figure Page
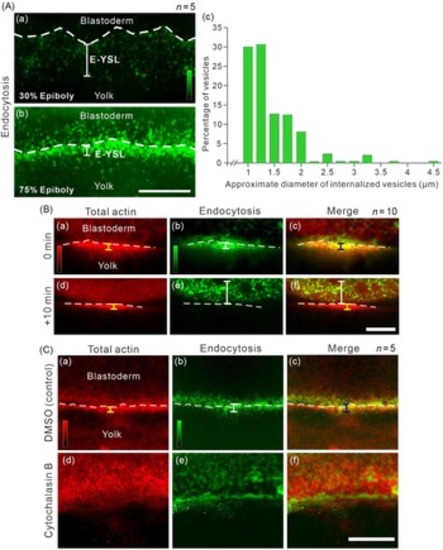
The internalization of a 10-kDa FITC-labelled dextran in the absence or presence of cytochalasin B during epiboly. (A) Embryos were incubated with FITC-labelled dextran at (Aa) 30% or (Ab) 75% epiboly for 30 min and imaged at the blastoderm margin (n = 5 for each). (Ac) Histogram showing the size distribution of the internalized vesicles. (B) Embryos were injected with rhodamine-labelled actin at the single-cell stage and then bathed in FITC-labelled dextran at ∼75% epiboly. Images were acquired (Ba–Bc) immediately after or (Bd–Bf) 10 min after FITC–dextran removal, and show the localization of (Ba, Bd) total actin (Bb, Be) endocytosis and (Bc, Bf) the actin and endocytosis images when merged. (C) Effect of cytochalasin B on the localization of actin and endocytosis during epiboly. Embryos were injected with rhodamine-labelled actin and bathed in FITC-labelled dextran, as described in (B). At 50% epiboly some embryos were incubated with (Ca–Cc) DMSO (control) whereas others (Cd–Cf) were incubated with 5 µg/ml cytochalasin B. Images were acquired at ∼8 hpf, when the control embryos reached ∼75% epiboly. In (A–C), the dashed white lines indicate (when possible) the leading margin of the enveloping layer cells. In (B, C) the yellow and white measurement lines indicate the size of the region of highest red and green fluorescence, respectively, and the black measurement lines indicate the approximate region of overlap between the two. Scale bars, 50 µm. |