
FIGURE
Figure 4
- ID
- ZDB-FIG-240226-190
- Publication
- Yang et al., 2024 - Developmental Toxicity of PEDOT:PSS in Zebrafish: Effects on Morphology, Cardiac Function, and Intestinal Health
- Other Figures
- All Figure Page
- Back to All Figure Page
Figure 4
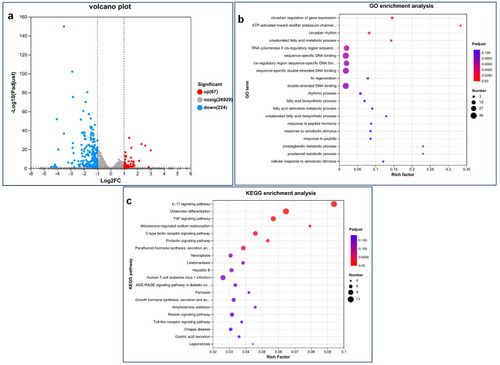
Transcriptome analysis of zebrafish at 120 hpf after exposure to 1 mg/L PEDOT:PSS. ( |
Expression Data
Expression Detail
Antibody Labeling
Phenotype Data
Phenotype Detail
Acknowledgments
This image is the copyrighted work of the attributed author or publisher, and
ZFIN has permission only to display this image to its users.
Additional permissions should be obtained from the applicable author or publisher of the image.
Full text @ Toxics