
Fig. 2
- ID
- ZDB-FIG-240221-9
- Publication
- Komiya et al., 2024 - Independent mesenchymal progenitor pools respectively produce and maintain osteogenic and chondrogenic cells in zebrafish
- Other Figures
- All Figure Page
- Back to All Figure Page
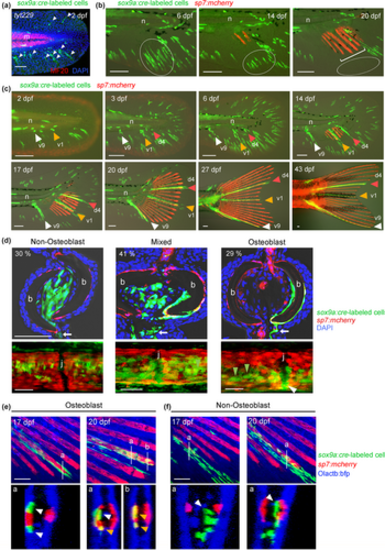
Clonal fate tracking of sox9a+ cells. (a) Confocal images of Cre-labeled EGFP+ cells in the fin fold at 2 dpf. Red fluorescence, immunostaining of myotomes (m) with the MF-20 anti-myosin antibody. The nuclei were stained with 4′,6-diamidino-2-phenylindole (DAPI). Note that the fin fold mesenchymes have a characteristic morphology (arrowheads). Scale bar, 50 μm. (b) Live cell tracking in the fin folds. Most EGFP+ cells disappeared during the larval stage (circled areas). Bracket, emerging fin ray osteoblasts (sp7:mcherry). n, notochord. Scale bars, 100 μm. (c) Time-lapse analysis of labeled cells that give rise to adult fin rays. One or a few cells located at the base of the fin fold at 2 or 3 dpf proliferated to become adult fin rays. In this example, the labeled cells give rise to v9 (white arrowheads), v1 (yellow arrowheads), and d4 (red arrowheads) rays. n, notochord. Scale bars, 100 μm. (d) Confocal images of cryosections (upper panels) and whole-mount views (lower panels) of adult fin rays with EGFP+ cells in non-osteoblast cells (left), osteoblasts (right), and both (middle) (n = 76 fin rays from 18 fish containing EGFP+ cells). Nuclei are labeled with DAPI. EGFP+ cells with non-osteoblast fates do not overlap with the osteoblast marker sp7, whereas EGFP+ cells with osteoblastic and mixed fates are distributed along the fin ray bone and express sp7. Note the presence of sp7− cells in the osteoblast-producing lineage (green arrowheads). Arrows, EGFP+ cells in the inter-ray region; b, fin ray bone; j, fin ray joints; white arrowhead, OPCs in joint. Scale bars, 50 μm. (e, f) Confocal images (top panels) and optical cross-sections (lower panels, positions are indicated as a and b) showing Cre-labeled cells and osteoblasts in Tg(sox9a:creERt2;BSG;sp7:mcherry). In (e), positions indicated with “a” at 17 and 20 dpf are approximately the same positions. Production of osteoblasts from sp7− mesenchymal progenitors is observed in the osteoblast lineage (e, yellow arrowheads), but not in the non-osteoblast lineage (f, white arrowheads). EGFP+/sp7− cells at 17 dpf (e, white arrowheads) became EGFP+/sp7+ cells at 20 dpf (e, yellow arrowheads). Scale bars, 50 μm. |