
Fig. 3
- ID
- ZDB-FIG-240215-25
- Publication
- Sundaramurthi et al., 2023 - Ergolide mediates anti-cancer effects on metastatic uveal melanoma cells and modulates their cellular and extracellular vesicle proteomes
- Other Figures
- All Figure Page
- Back to All Figure Page
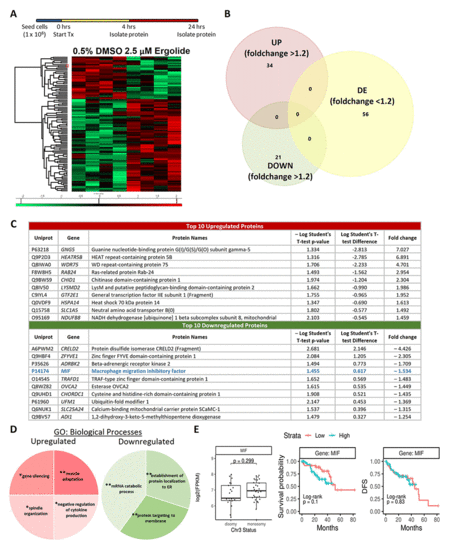
Proteome profiling following 24 hours ergolide treatment of OMM2.5 cells. (A) Schematic diagram depicting treatment regime and heatmap highlighting differentially expressed proteins. (B) Venn diagram showing the number of proteins significantly differentially expressed (up/down) or differentially expressed (DE), given a cutoff of p≤0.05 and a ≥ 1.2 fold change. (C) Table of top ten proteins that are significantly up- or down-regulated following 24 hours of ergolide treatment. (D) Pathways enriched for GO: Biological processes. (E) TCGA analysis of UM patient samples comparing MIF expression levels to chromosome 3 (Chr 3) status, overall survival and disease-free survival (DFS), (n = 80). |