
Fig. 2
- ID
- ZDB-FIG-240205-29
- Publication
- Vian et al., 2023 - In situ quantification of osmotic pressure within living embryonic tissues
- Other Figures
- All Figure Page
- Back to All Figure Page
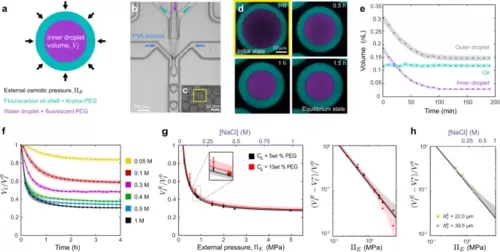
Characterization of double emulsion droplets at equilibrium. a Sketch of a double emulsion droplet indicating its composition and characteristics. Microfluidic generation (b) of double emulsion droplets (c). d Confocal section of a droplet in a 0.4 M NaCl solution over time showing the temporal reduction in droplet sizes. Fluorocarbon oil (cyan) and fluorescent PEG (purple) are shown (color code as sketched in a). e Temporal evolution of the inner droplet volume, (purple), the outer droplet volume, (gray) and the oil layer volume (cyan). Error bands are droplet segmentation errors. Representative case, N = 1. f Temporal evolution of the inner droplet volume, (normalized by the initial volume, ), for double emulsion droplets placed in NaCl solutions of varying osmolarities (Methods). N = 20 (yellow), 16 (red), 16 (purple), 15 (green), 21 (blue), 17 (black) droplets for f, g. Mean ± SD for f–h. g Measured dependence of the equilibrium inner droplet volume, (normalized by ), on the externally imposed osmotic pressure, , with initial PEG concentrations, c0 = 5% w/w (black circles) and 10% w/w (red circles). Linear scale, left panel; log-log scale, right panel. Black and red lines are fits of Eq. 1 to the data with associated confidence bands (68%). Measured equilibrium volumes of the inner droplet for droplets with c0 = 5% w/w (black asterisk) and 10% w/w (red asterisk) when placed in cell culture media of known osmolarity. N = 13 (black), 25 (red) droplets. Small inset is a magnified region of g. h Initial size dependence of, , on for droplets of initial radius, (large droplets, = 33.5 ± 0.6 µm, blue, N = 26 (0.5 MPa), 23 (0.75 MPa), 18 (1.5 MPa), 23 (2 MPa); small droplets: = 12.2 ± 0.3 µm, green, N = 26 (0.5 MPa), 23 (0.75 MPa), 18 (1.5 MPa), 23 (2 MPa)) but same c0 (5% w/w). Black line is the calibration curve (fit in g) for c0 = 5% w/w. CB (68%) is shown. Source data are provided as a Source Data file. |