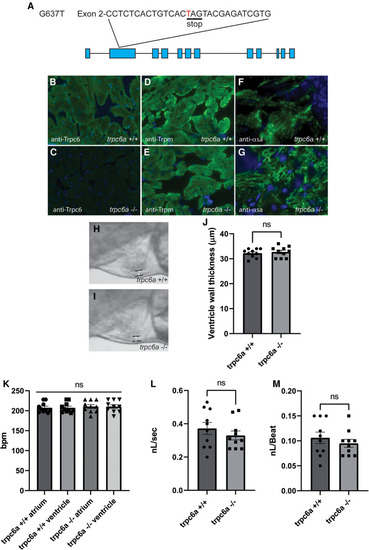
Loss of Trpc6a does not affect cardiac development. (A) Diagram of the point mutation carried by the sa23930 zebrafish transgenic line. The G637T mutation causes a premature stop codon in the Exon 2 of the trpc6a. (B,C) IHC images from adult heart sections showing the presence of Trpc6 in the myocardium of trpc6a+/+ but absent from the myocardium of trpc6a−/− zebrafish. Trpc6: green, DAPI: blue. (D,E) IHC images from adult heart sections showing the organization of tropomyosin (Trpm) in myocardium of trpc6a+/+ and in trpc6a−/− zebrafish. Trpm: green, DAPI: blue. (F,G). IHC images from adult heart sections showing the organization of α-sarcomeric actin (α-sa) in the myocardium of trpc6a+/+ and in trpc6a−/− zebrafish. α-sa: green, DAPI: blue. (H,I) Representative morphology of the ventricular wall of 5dpf larvae from control (trpc6a+/+, H) and trpc6a KO (trpc6a−/−,I) groups. (J) Ventricular wall thickness measurements of 5dpf larvae during diastole. T-test was used for statistical analysis. (K) Atrial and ventricular contraction rates (in bpm) of trpc6a+/+ and trpc6a−/− 5dpf larvae. 1-way ANOVA was used for statistical analysis. (L) Blood flow velocity (in nL/s) measured in the caudal vein at 5dpf. T-test was used for statistical analysis. (M) Cardiac output (in nL/beat) of trpc6a+/+ and trpc6a−/− 3dpf larvae. t-test was used for statistical analysis. (H–M) Data obtained on n = 10 larvae per group.
|
