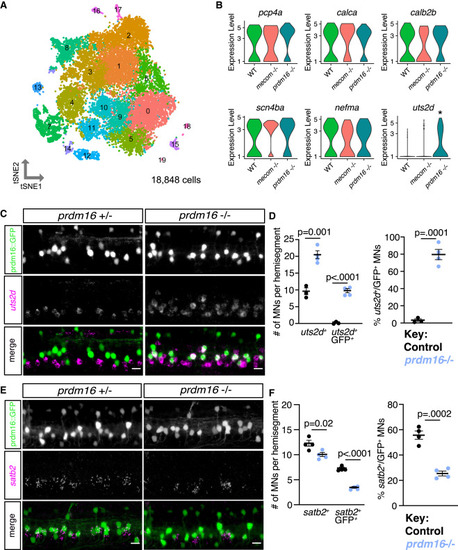
Erosion of fast motor neuron transcriptional profiles in prdm16 mutants (A) tSNE representing all MNs from WT (8,145), mecom mutant (4,210), and prdm16 mutant (6,493) larvae at 5 dpf. Cluster 14 was determined to be fast MNs (WT, n = 88; mecom mutant, n = 40; and prdm16 mutant, n = 65). (B) Violin plots representing log fold expression of fast MN markers (pcp4a, calca, calb2b, scn4ba, nefma) and slow MN marker (uts2d) in cluster 14 of (A) identified as normally Prdm16+ fast MNs. uts2d showed a 3 log fold change increase in prdm16 mutants (adjusted p = 0.0194). (C) FISH of uts2d in Tg(prdm16::GFP) control and prdm16 mutant larvae at 5 dpf. Scale bars, 10 μm. (D) Left: quantification of uts2d+ cells and GFP+uts2d+ cells in Tg(prdm16::GFP) larvae at 5 dpf as in (C). Right: percentage of total GFP+ cells that express uts2d. Line indicates average with SEM. Unpaired t tests. (E) FISH of satb2 in Tg(prdm16::GFP) control and prdm16 mutant larvae at 5 dpf. Scale bars, 10 μm. (F) Left: quantification of satb2+ cells and GFP+; satb2+ cells in Tg(prdm16::GFP) larvae at 5 dpf as in (E). Right: percentage of total GFP+ cells that express satb2. Line indicates average with SEM. Unpaired t tests.
|
