
Fig. 4
- ID
- ZDB-FIG-240112-5
- Publication
- Bhat et al., 2023 - SLAMseq resolves the kinetics of maternal and zygotic gene expression during early zebrafish embryogenesis
- Other Figures
- All Figure Page
- Back to All Figure Page
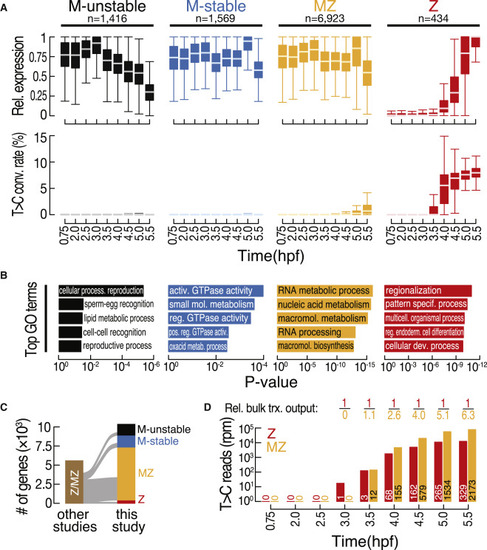
Classification of the zebrafish transcriptome during MZT reveals zygotic re-expression of most maternal genes (A) Classification of the transcriptome by k-medoids clustering (see Figure S4A) was based on gene expression (top) and T>C conversion rates (bottom) at the indicated developmental time points (in hpf). Only genes above expression cutoff (5 rpm) at any time point were considered. Genes (n) were classified into maternal unstable (M unstable; black), maternal stable (M stable; blue), maternal-zygotic (MZ; yellow), and zygotic (Z; red). Gene expression was calculated for each gene relative to the maximum observed expression. See also Table S3. (B) Top five Gene Ontology (GO) terms significantly enriched in each of the gene classes described in (A). (C) Sankey diagram reports a comparison of 3′ mRNA SLAMseq-based gene classifications (this study) with previously reported zygotic (i.e., zygotic or MZ) gene annotations.4,7,19 (D) Quantification of bulk zygotic expression (i.e., T>C reads in rpm) of zygotic (red) or MZ (yellow) genes at the indicated time points (in hpf). The number of genes considered at each time point is indicated. The relative (rel.) bulk transcriptional (trx.) output reports the relative abundance of T>C reads derived from all zygotic (red) or MZ (yellow) genes. |