
Fig. 7
- ID
- ZDB-FIG-240112-28
- Publication
- Wang et al., 2023 - Amacrine cells differentially balance zebrafish color circuits in the central and peripheral retina
- Other Figures
- All Figure Page
- Back to All Figure Page
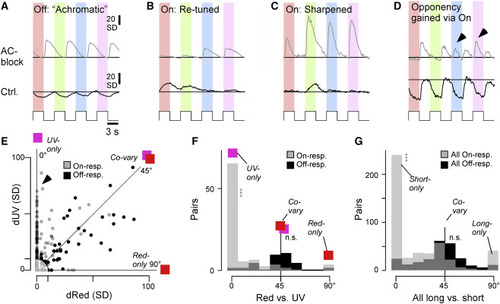
Selective spectral modulation of the On pathway (A–D) Selected example BC color-step responses (trial averages) during the control condition (bottom) and following AC block (top, paired data), illustrating a range of “typical” results. Generally, changes in Off responses tended to be similar across all tested wavelengths (A). In contrast, changes in On responses tended to be more spectrally diverse and often effected a change in overall spectral tuning (B and C), including in spectral opponency (D). Arrowheads in (D) highlight wavelength-specific switches in the On channel that led to a change in color opponency. (E–G) Co-variation of absolute response amplitudes changes (in SD) after AC blockage, compared across different pairs of wavelengths (paired data). (E) shows an individual scatterplot for red versus UV. On and Off responses are plotted separately, as indicated. Correspondingly, an angular histogram (F) was computed from this scatterplot, where 45° indicates co-variation, while peaks around 0° and 90° indicate that one of the two compared wavelength responses changes independently of the other. Data points with an Euclidean distance of less than 10 from the origin were excluded from further analysis (shaded area in E). (F) shows the individual red-UV comparison, while (G) shows the sum of all six possible color combinations (cf. Figure S10). Note that Off responses tended to co-vary (peak at 45°), while On responses exhibited a more diverse distribution, which included peaks at 0°, 45°, and 90°. Wilcoxon signed-rank test for a given color combination; tests were performed between On or Off angular distributions and 45°; all On (G): p < 0.001, all Off (G): p = 0.32; red On (F): p < 0.001 (red versus UV), Off: p = 0.24 (red versus UV). |