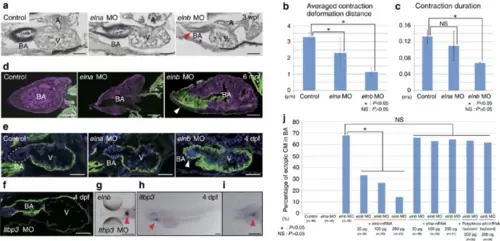
Functions of elna and elnb in BA development. (a) Morphology of BA and elastin accumulation in elna and elnb zebrafish morphants at 3 weeks post-fertilization (wpf). Elastica van Gieson staining highlights hypoplasia and decreased elastin accumulation in elnb morphant BA (arrowhead). Scale bars, 50 μm. (b) Averaged contraction deformation distances in control, elna and elnb morphant BAs. Averaged contraction deformation distances in the elna and elnb BA are significantly reduced compared with that of the control. n=4 each. *P<0.05, NS: P>0.05 (c) Contraction durations in control, elna and elnb morphant BAs. Contraction duration in elnb BA is greatly reduced compared with that of the control. n=4 each. *P<0.05, NS: P>0.05 (d) Anatomy and histology of BA in control, elna and elnb morphants at 6 months post-fertilization (mpf) using double immunohistochemistry; α-sarcomeric actinin (cardiac muscle, green) and myosin light-chain kinase (smooth muscle, magenta). Ectopic cardiomyocytes are observed in elnb morphant BA (arrowhead). Scale bars, 200 μm. This is also the case with embryonic hearts (e). Scale bars, 50 μm. (f) Anatomy and histology of BA in ltbp3 morphants at 4 dpf. Ectopic cardiomyocytes are observed in ltbp3 morphant BA with deformation of heart morphology. Scale bar, 50 μm. (g) elnb expression pattern in ltbp3 morphants at 4 dpf. Expression pattern of elnb is not altered in ltbp3 morphants. Arrowhead indicates elnb expression. Scale bar, 200 μm. (h,i) ltbp3 expression pattern at 4 dpf embryos. ltbp3 is expressed in the BA (arrowheads). Scale bars, 200 μm. (j) Functional divergence of elna and elnb in morphogenesis of the BA. Rescue experiment of elnb morphants by injection of elna, elnb and Polypterus eln full-length mRNAs. Percentages of ectopic cardiomyocytes in the BA are shown in each condition. elna and Polypterus eln mRNA did not rescue the elnb morphant phenotypes while elnb mRNA did. *P<0.05, NS: P>0.05. Dashed lines depict outlines of the BA. Values are reported as mean±s.d. and P values were determined by the t-test. NS, not significant.
|
