
Fig. 4
- ID
- ZDB-FIG-231213-33
- Publication
- Wasilewska et al., 2023 - Lack of Stim2 Affects Vision-Dependent Behavior and Sensitivity to Hypoxia
- Other Figures
- All Figure Page
- Back to All Figure Page
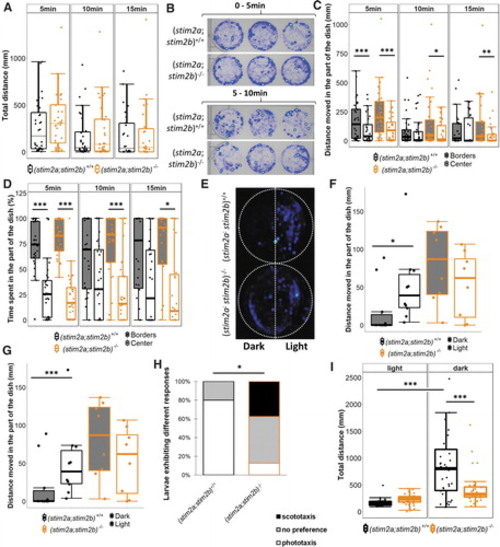
Mobility and thigmotaxis in (stim2a;stim2b)+/+ and (stim2a;stim2b)−/− 4 dpf larvae in the open-field test. (A) Total distance travelled and (B) mean heat maps of traces of larvae in both groups, divided into 5-min periods. (C) Distance travelled and (D) proportion of time spent in parts of well. n = 32 (stim2a;stim2b)+/+ larvae and n = 33 (stim2a;stim2b)−/− larvae. The Wilcoxon rank sum test was used to compare mutant and (stim2a;stim2b)+/+ fish. The paired t-test was used to compare borders and the center. (E–H) Behavior of (stim2a;stim2b)+/+ and (stim2a;stim2b)−/− 4 dpf larvae in the dark-light preference test. (E) Mean heat maps of traces of (stim2a;stim2b)+/+ and mutant larvae. (F) Total distance covered and (G) proportion of time spent in parts of the dish in larvae from both groups. (H) Proportion of larvae that exhibited phototaxis (>70% of time spent in the light), scototaxis (<30% of time spent in the light), or no preference. n = 10 (stim2a;stim2b)+/+ larvae, n = 8 (stim2a;stim2b)−/− larvae. The Wilcoxon rank sum test was used to compare mutant and (stim2a;stim2b)+/+ fish. The paired t-test was used to compare borders and the center. The response distribution was compared using theχ2 test. (I) Visual-motor response test. Total distance covered during the 10-min period after switching the light on (light) and during subsequent 10-min period after switching the light off (dark). n = 36 (stim2a;stim2b)+/+ larvae, n = 36 (stim2a;stim2b)−/− larvae. The effects of light condition and genotype on mobility were compared using two-way analysis of variance followed by the Tukey Honestly Significant Difference post hoc test. *p < 0.05, **p < 0.01, ***p < 0.001. dpf, days |