
Fig. 1
- ID
- ZDB-FIG-231212-85
- Publication
- Syahirah et al., 2023 - Method for Visualization of Emergency Granulopoiesis in the Zebrafish Embryo
- Other Figures
- All Figure Page
- Back to All Figure Page
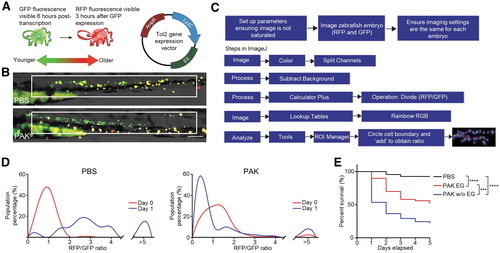
Visualizing neutrophil emergency granulopoiesis. (A) Schematic of drFP58312 (timer) protein function and plasmid construction. (B) Representative images of PBS or PAK-injected zebrafish embryos in the CHT region (white box). (C) Steps to quantify the RFP/GFP ratio of images in ImageJ. (D) RFP/GFP ratio quantification of neutrophils in CHT from (B) where n ≥ 20 in each group. (E) Survival of zebrafish larvae with or without EG after intravenous injection of 1000 CFU of PAK. In (E), a representative experiment of three independent experiments (n ≥ 20 in each group) is shown, using the Gehan–Breslow–Wilcoxon test. Scale bar: 100 μm. CHT, caudal hematopoietic tissue; EG, emergency granulopoiesis; GFP, green fluorescent protein; PAK, Pseudomonas aeruginosa; PBS, phosphate buffered saline; RFP, red fluorescent protein; RGB, red green blue; ROI, region of interest. |