|
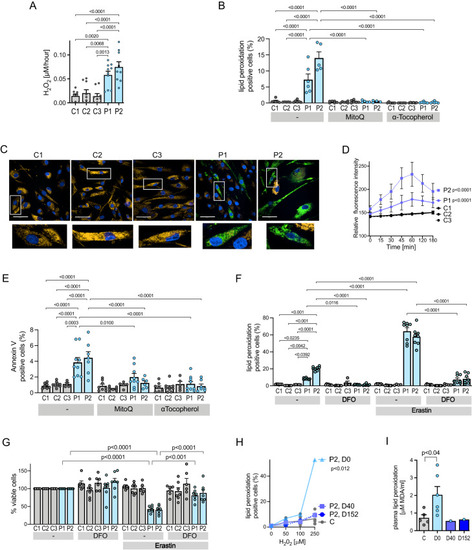
Increased oxidative stress, apoptosis and susceptibility to ferroptosis in aortic vascular smooth muscle cells. A H2O2 production in aortic VSMCs from patients P1, P2 (blue bars) and controls (C1, C2, C3: grey bars). Statistics: Ordinary one-way ANOVA with adjusted P values (Tukey’s multiple comparison test), each bar represents the mean (n ≥ 8 independent experiments), error bars represent SEM, p-values compare P1 and P2 with controls. B Membrane lipid peroxidation in aortic VSMCs from patients P1, P2 (blue bars) and controls (C1–C3: grey bars), with exposure to the vehicle, MitoQ or α-tocopherol. Statistics: Two-way ANOVA with adjusted P values (Tukey’s multiple comparison test), each bar represents the mean (n ≥ 4 independent experiments), error bars represent SEM, p-values compare P1 and P2 with controls, or vehicle-treated data from P1 and P2 with antioxidant-treated cells. C Representative microscopic images of primary, aortic vascular smooth muscle cells from controls (C1, C3, C3) or patients (P1, P2) following 1 h exposure to MitoPerOx, a fluorescent probe assessing lipid peroxidation within mitochondria, with insets below showing high power views of single cells. Each image was acquired independently ten times, with similar results. Scale bars: 50 μm. D Quantitation of relative fluorescence intensity (RFI) in primary VSMCs from patients (blue lines; P1 solid line; P2 broken line) and three controls (C1, C3, C3: black lines), treated with MitoPerOx over the time period indicated. Statistics: Unpaired, two-tailed t-test, error bars represent SEM, p-values compare patient versus controls (n = 10 independent experiments). E Apoptosis (Annexin V positive cells) of aortic VSMCs from patients P1, P2 (blue bars) and controls (C1–C3: grey bars), with exposure to the vehicle, MitoQ or α-tocopherol. Statistics: Two-way ANOVA with adjusted p values (Tukey’s multiple comparison test), each bar represents the mean (n ≥ 5 independent experiments), error bars represent SEM, p-values compare P1 and P2 with controls, or vehicle-treated data from P1 and P2 with antioxidant-treated cells. F and G. Membrane lipid peroxidation (F) and cell viability (G) of aortic VSMCs from patients (P1, P2: blue bars) and controls (C1–C3: grey bars), with exposure to vehicle, erastin or desferrioxamine (DFO). Statistics: Two-way ANOVA with adjusted p values (Tukey’s multiple comparison test), each bar represents the mean (F:n ≥ 4; G:n = 6 independent experiments), error bars represent SEM, p-values in F compare untreated/treated P1 and P2 with control cells treated similarly (ns: not significant). H and I H2O2-induced peroxidation of membrane lipid in PBMCs (J) or serum (K) from patient P2 at different days of dietary supplementation with α-tocopherol (D0: day 0, light blue), 40 (D40: day 40, shaded blue) or 152 (D152: day 152, dark blue) or untreated control subjects (C: grey). Statistics: H Two-way ANOVA, each line represents the mean for controls (n = 5) and single values for P2, p-value compares P2 D0 with controls. I Unpaired, two-tailed t-test, each bar represents the mean for controls (n = 5) and untreated P2 (n = 6), or single values for P2 treated for different numbers of days as indicated. Source data are provided as a Source Data file.
|