
Figure 3—figure supplement 1.
- ID
- ZDB-FIG-231122-5
- Publication
- Kim et al., 2023 - scMultiome analysis identifies embryonic hindbrain progenitors with mixed rhombomere identities
- Other Figures
-
- Figure 1—figure supplement 1.
- Figure 1—figure supplement 1.
- Figure 2—figure supplement 1.
- Figure 2—figure supplement 1.
- Figure 3—figure supplement 1.
- Figure 3—figure supplement 1.
- Figure 4—source data 1.
- Figure 5—figure supplement 1.
- Figure 5—figure supplement 1.
- Figure 5—figure supplement 2.
- Figure 5—figure supplement 3.
- Figure 5—figure supplement 4.
- Figure 5—figure supplement 5.
- Figure 5—figure supplement 6.
- Figure 5—figure supplement 7.
- Figure 6—figure supplement 1.
- Figure 6—figure supplement 1.
- Figure 7—figure supplement 1.
- Figure 7—figure supplement 1.
- Figure 7—figure supplement 2.
- Figure 8.
- All Figure Page
- Back to All Figure Page
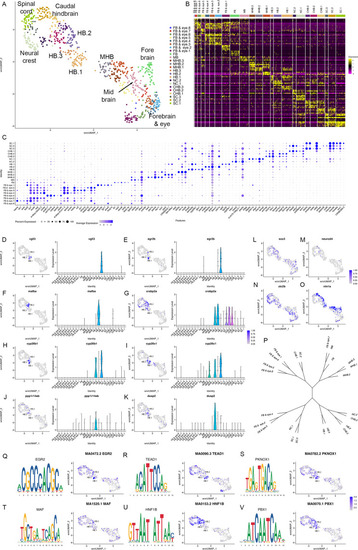
(A) UMAP of 10hpf neural clusters. (B, C) Heat map (B) and dot plot (C) showing the expression of the top five enriched genes in each cluster. (D-K) Expression of rhombomere-specific genes are shown as feature plots (left panels) and violin plots (right panels). (L-M) Feature plots showing the expressing of sox3 (L) and neurod4 (M). (N, O) Feature plots showing the expression of dorsoventral marker genes. (P) Dendrogram showing the relationship between the 10hpf neural clusters. (Q-V) Rhombomere-enriched accessible transcription factor binding motifs are shown as a motif logo (left panels) and as a feature plot of chromVar activity (right panel). HB = hindbrain, NC = neural crest. See legend to Figure 1 for additional abbreviations. |