
Fig. 7
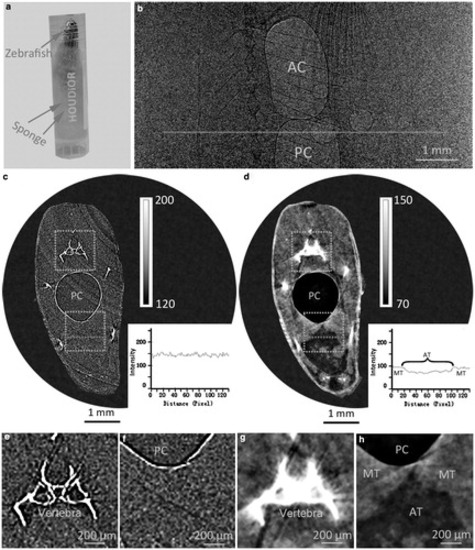
Comparison of the soft tissue visibility between PR-free PCCT and PR-based PCCT for living zebrafish. (a) Anesthetized zebrafish was placed in water and fixed by sponge in a plastic tube. (b) Projection image of a part of the zebrafish body. (c–d) Are axial PR-free PCCT image and PR-based PCCT image, respectively, at the level marked by the dotted line in (b). The adjusted gray value scalings are given on the right. Line profile analyses along the dotted lines are displayed. Note that PR processing enabled more contrast difference between adipose tissue and muscle tissue. Posterior chamber was definitely shown on both PR-free PCCT and PR-based PCCT images. (e–h) Are magnified images of the regions in the dotted boxes shown in (c, d), respectively. Note that the vertebra was clearly shown on the PR-free PCCT image (e), whereas the apparent thickness of the vertebra increased on the PR-based PCCT image with soft-tissue gray value scaling (g). The adipose tissue and muscle tissue were more visible on the PR-based PCCT image (h) than on the PR-free PCCT image (f). AT, adipose tissue; MT, muscle tissue. |