
FIGURE
Fig. 3
- ID
- ZDB-FIG-230905-3
- Publication
- Liu et al., 2023 - Ferroptosis of brain microvascular endothelial cells contributes to hypoxia-induced blood-brain barrier injury
- Other Figures
- All Figure Page
- Back to All Figure Page
Fig. 3
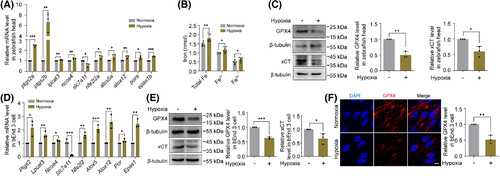
Hypoxia induces ferroptosis in cerebrovascular endothelial cells. (A) The mRNA expression levels of ferroptosis-related genes in the head of zebrafish were evaluated by RT-qPCR. Mean ± SD, Student's t-test, *p < .05, **p < .01, ***p < .001. N = 80 fish per group. (B) Measurement of iron content in zebrafish head. Mean ± SD, Student's t-test, normoxia vs. hypoxia (Total Fe), **p = .0047; normoxia vs. hypoxia (Fe2+), *p = .011; normoxia vs. hypoxia (Fe3+), *p = .039. N = 150 fish per group. (C) Immunoblotting analysis of GPX4 and xCT in the head of zebrafish. Mean ± SD, Student's t-test, normoxia vs. hypoxia (GPX4), **p = .002; normoxia vs. hypoxia (xCT), *p = .034. N = 100 fish per group. (D) The mRNA expression levels of ferroptosis-related genes in bEnd.3 cells were calculated by RT-qPCR. Mean ± SD, Student's t test, *p < .05, **p < .01, ***p < .001. (E) Protein expression level of GPX4 and xCT in bEnd.3 cells was analyzed by immunoblotting analysis. Mean ± SD, Student's t test, normoxia vs. hypoxia (GPX4), ***p < .001; normoxia vs. hypoxia (xCT), *p = .014. (F) Immunofluorescence staining and quantification of GPX4. Mean ± SD, Student's t-test, **p = .0034. Scale bar: 10 μm.
|
Expression Data
Expression Detail
Antibody Labeling
Phenotype Data
Phenotype Detail
Acknowledgments
This image is the copyrighted work of the attributed author or publisher, and
ZFIN has permission only to display this image to its users.
Additional permissions should be obtained from the applicable author or publisher of the image.
Full text @ FASEB J.