
FIGURE
Fig 10
Fig 10
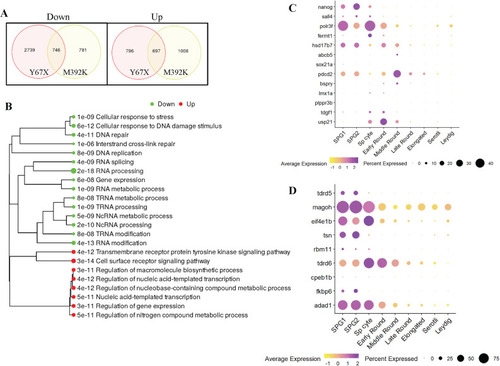
Bulk RNAseq from wild-type and mutant testes. A: Venn diagrams showing numbers of differentially expressed genes in each mutant line compared to their wild-type siblings using fold change >1.5 and false discovery rate (FDR) <0.05 as the cutoff. B: Gene ontogeny pathway analysis performed on genes that were dysregulated in both |
Expression Data
Expression Detail
Antibody Labeling
Phenotype Data
Phenotype Detail
Acknowledgments
This image is the copyrighted work of the attributed author or publisher, and
ZFIN has permission only to display this image to its users.
Additional permissions should be obtained from the applicable author or publisher of the image.
Full text @ PLoS Genet.