|
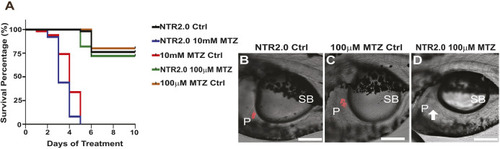
Chronic hyperglycemia can be achieved in larvae using NTR2.0 fish. (A) Survival curve: ins:mCherry NTR2.0ir2018 larvae treated for 10 days (3 dpf to 13 dpf) with no MTZ (NTR2.0 Ctrl), 100 µM MTZ (NTR2.0 100 µM MTZ) or 10 mM MTZ (NTR2.0 10 mM MTZ). Other controls included ins:dsRedm1018 larvae treated with 10 mM MTZ (10 mM MTZ Ctrl) and 100 µM MTZ (100 µM MTZ Ctrl). (B,C) Confocal images (each a single optical section) showing the presence of fluorescently labeled β cells in the trunk region of 13 dpf control larvae: NTR2.0 Ctrl (B) and 100 µM MTZ Ctrl (C). (D) β cells are not detected (white arrow) in NTR2.0 100 µM MTZ larvae, indicating that this treatment is sufficient to ablate β cells and prevent the regeneration new β cells. Scale bars: 100 µm. Anterior to the left, dorsal at the top. P, pancreas; SB, swim bladder.
|