
FIGURE 1
- ID
- ZDB-FIG-230814-233
- Publication
- McClure et al., 2023 - 3' RNA-seq is superior to standard RNA-seq in cases of sparse data but inferior at identifying toxicity pathways in a model organism
- Other Figures
- All Figure Page
- Back to All Figure Page
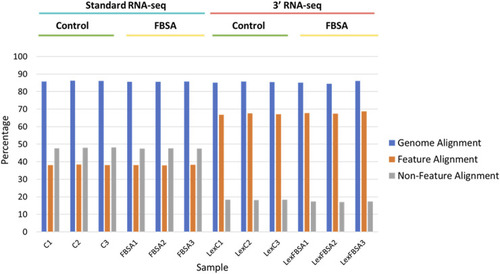
Alignment of standard and 3′ RNA-seq data. Percentage alignment is shown against the entire genome (blue bars), against regions of the genomes with annotated features (mRNA, tRNA, rRNA, other known non-coding RNA, orange bars) or against non-feature regions (grey bars). Individual samples are shown on the x-axis with sample groupings indicated above. C = standard RNA-seq samples from fish treated with control conditions, FBSA = standard RNA-seq samples from fish treated with FBSA, LexC = 3′ RNA-seq samples from fish treated with control conditions, LexFBSA = 3′ RNA-seq samples from fish treated with FBSA. Numbers at the end of the sample names indicate biological replicates. |