|
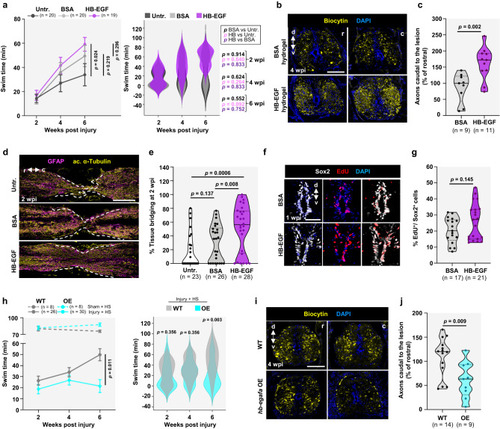
Effects of Hb-egf supplementation on spinal cord regeneration. a Swim tests in fish treated with HR-HB-EGF hydrogel (purple), BSA hydrogel (gray), or untreated (charcoal gray) at the site of a spinal cord crush injury. Two-way repeated-measures ANOVA tests with Holm-Šidák correction were used for comparisons. b, c Cross sections of BSA- and HR-HB-EGF-hydrogel-treated spinal cords located rostral and caudal to the transection site, after anterograde axon tracing at 4 wpi. Quantification shown in (e). N = 4. A two-tailed unpaired t-test with Welch’s correction was used for comparison. d Longitudinal sections indicating GFAP (magenta) and acetylated α-Tubulin (red) immunofluorescence at 2 wpi in fish treated with BSA- or HR-HB-EGF-loaded hydrogel. Dashed lines delineate sites of tissue bridging. N = 4. e Quantification of tissue bridging. Mann–Whitney tests were used for comparisons. N = 3. f, g Ependymal cell cycling assessed by EdU (red) incorporation in spinal cords of fish treated with vehicle (BSA)- or HR-HB-EGF-loaded hydrogel, shown as transverse sections at 1 wpi. Quantification shown in (c). N = 3. A two-tailed Mann–Whitney test was used for comparisons. h Swim capacity assayed in WT (gray, full line) or hb-egfbOE (cyan, full line) animals at 2, 4 and 6 wpi, and in uninjured animals (dashed lines). Whole-animal hb-egfa overexpression impairs recovery. Two-way repeated-measures ANOVA tests with Holm-Šidák correction were used for comparisons. p values for sham groups in left graph, dashed lines, are p = 0.764 at 2 weeks and p = 0.028 at 6 weeks. p = 0.011 shown in left panel represents comparison of performance over all timepoints. i, j Cross sections of wild-type (WT) and hb-egfaOE spinal cords located rostral or caudal to the transection site, after anterograde axon tracing at 4 wpi. Quantification shown in (h). N = 4. A two-tailed unpaired t-test with Welch’s correction was used for comparison. Scale bars 50 μm in (f), 200 μm in (d), 100 μm in (b, i). Error bars in (a, h) indicate SEM. r rostral, c caudal, d dorsal, v ventral. n = number of animals used for the experiments. Source data are provided as a Source Data file.
|