
FIGURE
Fig. 6.
- ID
- ZDB-FIG-230814-139
- Publication
- Genuth et al., 2023 - Automated time-lapse data segmentation reveals in vivo cell state dynamics
- Other Figures
- All Figure Page
- Back to All Figure Page
Fig. 6.
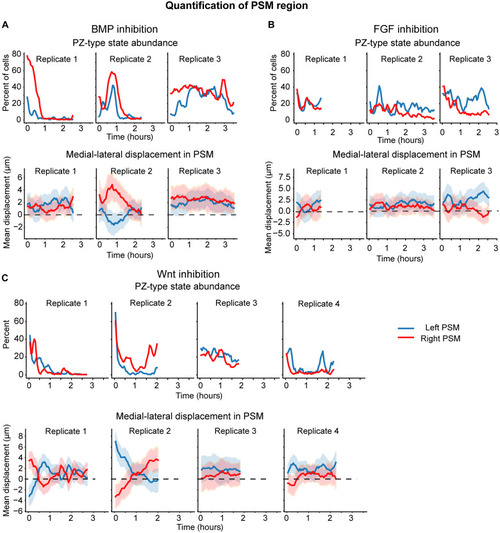
PSM region cell motion dynamics after BMP, FGF, or Wnt signaling inhibition. Track statistics in ROIs of the left and right PSM after ( |
Expression Data
Expression Detail
Antibody Labeling
Phenotype Data
Phenotype Detail
Acknowledgments
This image is the copyrighted work of the attributed author or publisher, and
ZFIN has permission only to display this image to its users.
Additional permissions should be obtained from the applicable author or publisher of the image.
Full text @ Sci Adv