
Figure 4
- ID
- ZDB-FIG-230724-48
- Publication
- Herget et al., 2023 - Altered glucocorticoid reactivity and behavioral phenotype in rx3-/- larval zebrafish
- Other Figures
- All Figure Page
- Back to All Figure Page
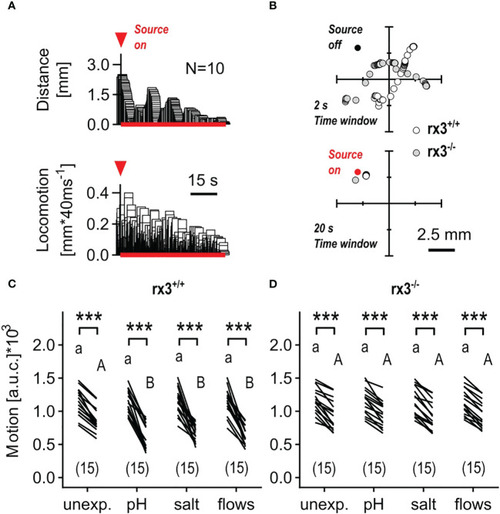
Response to minute water motions in rx3+/+ and rx3-/- zebrafish larvae under basal and stressed conditions. (A) Representative average trace of a wildtype larva’s distance to the stimulus source (top) and swimming activity (bottom) after the onset of mWMs. Red arrow heads in A depict the onset of stimulation. (See also Figure 3 in 50.) (B) Representative examples of consecutive x-y coordinates (swim trajectories) measured every 40 msec from rx3+/+ and rx3-/- larvae without (top) and with (bottom) mWMs. Top, 50 x-y coordinates per larva without mWMs (source off) measured over the last 2 s before the onset of mWMs. Bottom, 500 x-y coordinates per larva with mWMs (source on) measured over the last 20 s before the offset of mWMs. The time window in bottom (20 s) is enlarged 10 times relative to top (2 s) with the sole purpose of highlighting the mWMs-derived lack of locomotion observed typically at the end of a 2 min stimulation period. (C, D) Motion level, i.e., the area under the swim velocity-time curve over 120 s, across groups of unexposed and pre-exposed (same groups as in Figure 3B, C) rx3+/+(C) and rx3-/-(D) larvae before and during mWMs (see also Methods). Sample size in parentheses. (C, D) Letters and asterisks indicate results of Bonferroni’s tests (P<0.001) after two-way repeated measures ANOVAs; (C) time factor: F(1,56)=359.3, P<0.0001, treatment factor: F(3,56)=1.6, P=0.20, time × treatment factor: F(3,56)=5.6, P=0.002; (D) time factor: F(1,56)=317.0, P<0.0001, treatment factor: F(3,56)=0.03, P=0.99, time × treatment factor: F(3,56)=0.14, P=0.94. |