
FIGURE
Figure 1
- ID
- ZDB-FIG-230711-9
- Publication
- Kuil et al., 2023 - Unbiased characterization of the larval zebrafish enteric nervous system at a single cell transcriptomic level
- Other Figures
- All Figure Page
- Back to All Figure Page
Figure 1
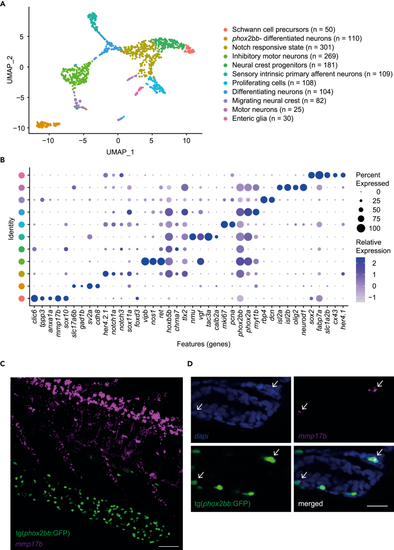
Single cell transcriptomics of 5 dpf zebrafish ENS (A) UMAP of 1369 ENS cells, containing eleven different clusters. (B) Dot plot showing expression of genes highly differentially expressed between clusters. (C) Maximum projection from FISH recordings of 5 dpf tg( (D) Single plane detailed images of FISH of 5 dpf tg( |
Expression Data
Expression Detail
Antibody Labeling
Phenotype Data
Phenotype Detail
Acknowledgments
This image is the copyrighted work of the attributed author or publisher, and
ZFIN has permission only to display this image to its users.
Additional permissions should be obtained from the applicable author or publisher of the image.
Full text @ iScience