FIGURE

Fig. 3

ID
ZDB-FIG-230707-8
Publication
Ferlazzo et al., 2023 - Genome-wide screening in pluripotent cells identifies Mtf1 as a suppressor of mutant huntingtin toxicity
Other Figures
All Figure Page
Back to All Figure Page
Fig. 3

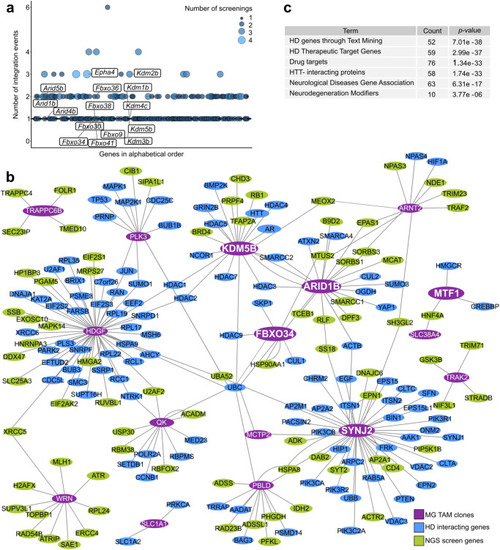
Network analysis of candidate suppressors of mHTT toxicity.

a Bubble plot representing the number of independent integration events for each NGS hit (1356 hits, represented by bubbles and ordered along the x axis in alphabetical order). Size and colours of the bubbles are related to the number of independent screening experiments in which they were found. Labels indicate relevant candidate genes and additional genes belonging to the same families. b The interactome, realised with Cytoscape141, shows physical and regulatory interactions of over-activated genes in mHTT-resistant clones with HD related genes, retrieved through HDNetDB56, and genes identified from NGS screening. Main nodes correspond to the mutated genes of HTT-resistant clones (violet label), HD related genes are marked with a blue label and hits from the NGS screening are represented with green labels. c Enrichment analysis of the genes represented in the interactome (Fig. 3b) based on HD gene sets using HDNetDB. Statistical enrichment and p-values were calculated using the hypergeometric distribution.

Expression Data

Expression Detail
Antibody Labeling
Phenotype Data

Phenotype Detail
Acknowledgments
This image is the copyrighted work of the attributed author or publisher, and ZFIN has permission only to display this image to its users. Additional permissions should be obtained from the applicable author or publisher of the image. Full text @ Nat. Commun.