
Figure 2.
- ID
- ZDB-FIG-230707-65
- Publication
- Chen et al., 2023 - Defining function of wild-type and three patient specific TP53 mutations in a zebrafish model of embryonal rhabdomyosarcoma
- Other Figures
-
- Figure 1
- Figure 1— supplement 1.
- Figure 1— supplement 2.
- Figure 2.
- Figure 3
- Figure 3—figure supplement 1.
- Figure 3—figure supplement 2.
- Figure 3—figure supplement 3.
- Figure 3—figure supplement 4.
- Figure 4
- Figure 4—figure supplement 1.
- Figure 4—figure supplement 2.
- Figure 4—figure supplement 3.
- Figure 5
- Figure 5—figure supplement 1.
- Figure 5—figure supplement 2.
- Figure 5—figure supplement 3.
- Figure 5—figure supplement 4.
- Figure 6
- Figure 6—figure supplement 1.
- Figure 6—figure supplement 2.
- Figure 6—figure supplement 3.
- Figure 6—figure supplement 4.
- Figure 7
- Figure 7—figure supplement 1.
- All Figure Page
- Back to All Figure Page
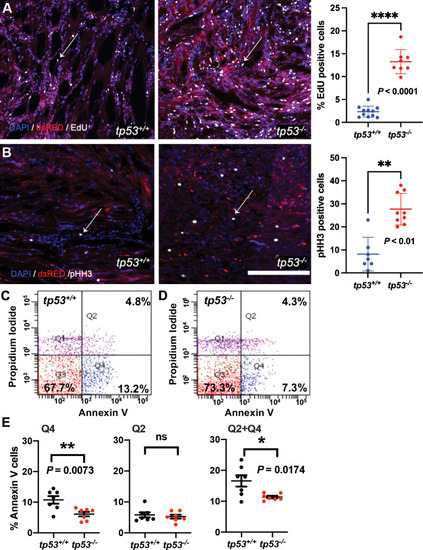
tp53 is a potent suppressor of proliferation and to a lesser extent of apoptosis. (A) Representative confocal microscopy images of EdU staining on embryonal rhabdomyosarcoma (ERMS) tumor sections and a plot quantifying the percentage of EdU-positive cells. Average of n = 8–11/primary tumors. White arrows show EdU-positive cells. (B) Representative confocal microscopy images of phospho-histone H3 staining on ERMS tumor sections (scale bar = 100 µm). Total number pHH3-positive cells per single ERMS tumor ×200 confocal image section assessed from n7-9 primary tumors. One the right-most panel is a plot quantifying the total number of pHH3-positive cells per single ERMS section. White arrows show pHH3-positive cells. (C, D) Representative flow cytometry analysis of Annexin V staining of tp53+/+and tp53-/- ERMS tumors, respectively. (E) Quantification of flow cytometry analysis of Annexin V staining. Q1 = pre-necrotic cells, Q2 = late apoptosis + necrotic cells, Q3 = living cells, Q4 = early apoptotic cells. n = 7. ns, not significant, p=0.5926, unpaired t-test |