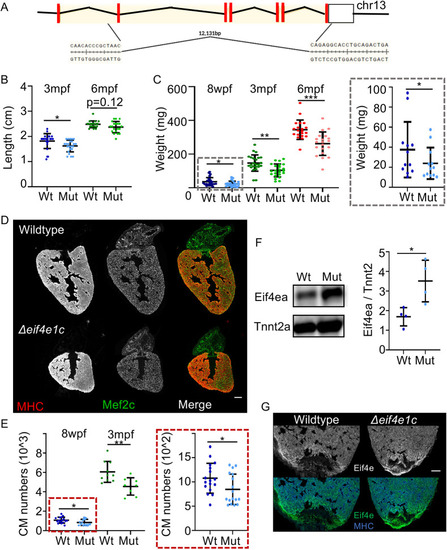
Δeif4e1c mutants have impaired growth and poor survival. (A) Schematic of the CRISPR-mediated deletion of eif4e1c. Red rectangles represent coding exons, and the white box represents exons with untranslated regions. (B) Fish were grown together, genotyped at the indicated stage and immediately measured from jaw to the caudal fin bifurcation (3-month average wild type=1.82 cm, mutant=1.62 cm; Welch's t-test, P=0.0156; n=24 and 23, respectively; 6-month average wild type=2.48 cm, mutant=2.37 cm; Mann–Whitney, P=0.121; n=20 and 20, respectively). (C) After measuring length, fish were dried off as much as possible and weighed. The 8 wpf data (gray box) is shown on the right with a different scale for the y-axis. [8-week (blue) average wild type=35.75 mg, mutant=22.82 mg; Welch's t-test, *P=0.0392; n=24; 3-month (green) average wild type=146.5 mg, mutant=103.1 mg; Welch's t-test, **P=0.0014; n=24 and 23, respectively; 6-month average (red) wild type=344.6 mg, mutant=261.7 mg; Welch's t-test, ***P=0.0002; n=20). (D) Uninjured heart ventricles from wild-type and mutant fish were sectioned and stained for muscle using antibodies to myosin heavy chain (MHC) and the cardiac transcription factor Mef2c to identify CM nuclei. Scale bar: 100 µm. Note that adjacent hearts have been removed from images for presentation purposes. (E) Numbers of Mef2c-positive cells were counted with MIPAR. The 8 wpf data (red box) is shown on the right with a different scale for the y-axis. [8-week (blue) average wild type=1078, mutant=848; Welch's t-test, *P=0.0383, n=17; 3-month (green) average wild type=6061, mutant=4557; Welch's t-test, **P=0.0052, n=10 and 8, respectively). (F) Left: Western blot of whole-cell extracts from zebrafish hearts using an antibody directed towards canonical Eif4ea (top) and Tnnt2a (bottom). Right: Quantification of western blots with total Eif4ea levels normalized to the sarcomeric protein Tnnt2a as a measure of total cardiac mass (average increase=1.82; Welch's t-test, *P=0.0334, n=4). (G) Immunofluorescence of canonical Eif4ea/b (top, grayscale; bottom, green) and MHC (blue, bottom). Scale bar: 100 µm. For each panel, the lighter shade color is used for mutants, individual data points are represented by dots, and error bars represent mean±s.e.m. Mut, mutant; Wt, wild type.
|
