
Fig. 5
- ID
- ZDB-FIG-230605-46
- Publication
- Boueid et al., 2022 - Pals1a and aPKCλ are not essential for Schwann cell migration, division or myelination in zebrafish
- Other Figures
- All Figure Page
- Back to All Figure Page
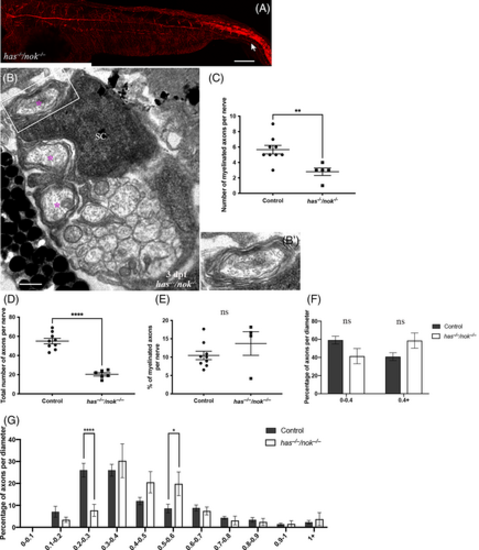
Schwann cells in has−/−/nok−/− double mutant do not show radial sorting or myelination defects. (A) Acetylated tubulin expression in has−/−/nok−/− embryo (n = 4 embryos) at 48 hpf (compare to Figure 1A). Scale bar = 100 μm. (B and B′) TEM of a cross section of the PLLn at 3 dpf in has−/−/nok−/− embryo (compare to Figure 4A,A′). Magenta asterisks represent some large caliber myelinated axons. SC, Schwann cell. Scale bars = 0.5 μm. (C) Quantification of the number of myelinated axons per nerve at 3 dpf in control (average of 5.6 ± 0.55, 9 nerves, n = 5 embryos) and has−/−/nok−/− (average of 2.75 ± 0.62, 5 nerves, n = 3 embryos) embryos (**P = .0024). (D) Quantification of the total number of axons per nerve at 3 dpf in control (average of 55 ± 2.85) and has−/−/nok−/− (average of 19.4 ± 1.72) embryos (****P ≤ .0001). (E) Quantification of the percentage of myelinated axons relative to the total number of axons per nerve at 3 dpf in control (average of 10.46 ± 1.14%) and has−/−/nok−/− (average of 13.70 ± 3.20%) embryos. (ns, P = .39). (F) Quantification of the percentage of axons relative to their diameter at 3 dpf in control (average of 59.15 ± 4.31% for 0-0.4 μm; average of 40.84 ± 4.2% for >0.4 μm) and has−/−/nok−/− (average of 41.44 ± 8.4% for 0-0.4 μm; average of 58.55 ± 8.5% for >0.4 μm) embryos. (ns, P > .09). (G) Graph representing the distribution of axons relative to their diameter with 0.1 μm bin width at 3 dpf in control and has−/−/nok−/− embryos (****P < .0001; *P = .024) |