
Fig. 3.
- ID
- ZDB-FIG-230602-6
- Publication
- Wesselman et al., 2023 - Esrrγa regulates nephron and ciliary development by controlling prostaglandin synthesis
- Other Figures
- All Figure Page
- Back to All Figure Page
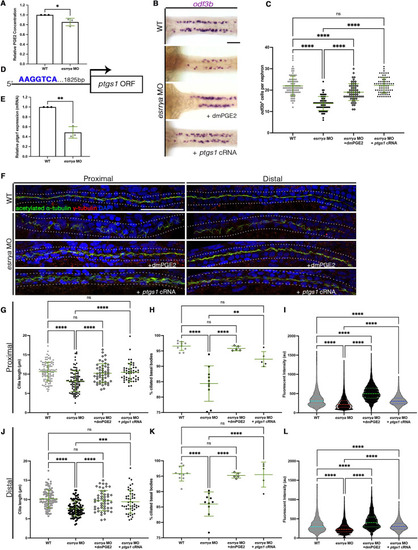
esrrγa controls ciliogenesis through regulation of prostaglandin signaling. (A) Relative PGE2 concentration. (B) WISH for MCCs (odf3b) at 28 ss. (C) MCCs per nephron. Each dot represents one nephron. Two nephrons were counted per animal. (D) Schematic of a putative Esrrγa binding site upstream of the ptgs1 open reading frame (ORF). (E) ptgs1 quantified via qRT-PCR. (F) IF for indicated markers at 28 hpf. Dotted lines indicate nephron tubule. (G,J) Cilia length in proximal (G) and distal (J) pronephros. Each dot represents one cilium. Ten cilia were measured per animal. (H,K) Percentage of ciliated basal bodies in proximal (H) and distal (K) pronephros. Each dot represents a single animal. (I,L) Fluorescent intensity plots (cilia, α-tubulin) for the same relative distance in proximal (I) and distal (L) pronephros. Each dot represents the fluorescent intensity of an animal at a given point across the segment of interest. (G-L) WT n=10, esrrγa MO n=10, esrrγa MO with dmPGE2n=5, esrrγa MO with ptgs1 cRNA n=5. Data are mean±s.d. *P<0.05, **P<0.01, ***P<0.001, ****P<0.0001 (unpaired t-test or one-way ANOVA). ns, not significant. Scale bars: 50 µm. |