
FIGURE
FIGURE 2
- ID
- ZDB-FIG-230601-27
- Publication
- Koslow et al., 2023 - Kidney transcriptome and cystic kidney disease genes in zebrafish
- Other Figures
- All Figure Page
- Back to All Figure Page
FIGURE 2
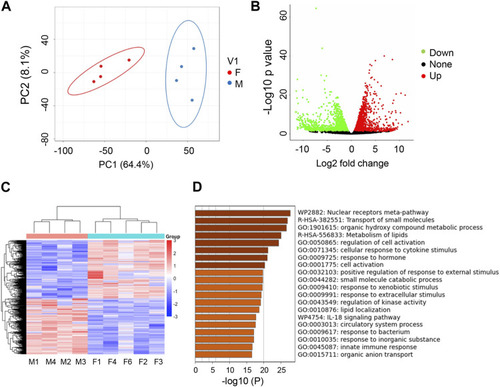
Transcriptome studies uncover sexual dimorphism in zebrafish kidneys. (A) PCA analysis of RNAseq data for male (M) vs. female (F) kidneys (4 replicates per group). (B) Volcano Plot of M vs. F kidneys (4 replicates per group). Significantly differentially expressed genes (−1.5 < log2FC > 1.5, FDR <5%) are highlighted green (downregulated) or red (upregulated). (C) Heatmap of total genes in M v F kidneys. (D) Metascape analysis of top differentiated pathways. |
Expression Data
Expression Detail
Antibody Labeling
Phenotype Data
Phenotype Detail
Acknowledgments
This image is the copyrighted work of the attributed author or publisher, and
ZFIN has permission only to display this image to its users.
Additional permissions should be obtained from the applicable author or publisher of the image.
Full text @ Front. Physiol.