
Fig. 4
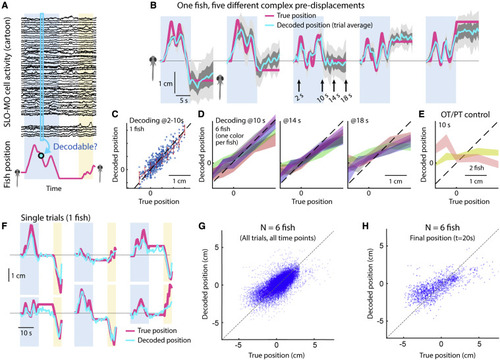
Decoding self-location from SLO-MO neuronal activity (A) Schematic of self-location decoding from SLO-MO population activity (cartoon data). (B) Decoding averages of complex location trajectories in pre-displacement and delay periods of stochastic displacement assay (dark gray: standard error [SEM], light gray: standard deviation [SD]). (Fish icons enlarged, not to scale.) (C) Decoding performance throughout pre-displacement period of example fish. (D) Decoding performance at start, middle, and end of delay period across N = 6 fish, showing gradually declining performance as SLO-MO memory decays over many seconds (colors: SEM for each fish). (E) Decoder trained on midbrain visual neurons performs poorly. (F) Example decoding of single trials, including first swim period. (G) Decoding self-location during entire trial across N = 7 fish, r = 0.54, p < 0.01. (H) Performance of decoding self-location at end of swim period (at t = 20 s), r = 0.68, p < 0.01. |
Reprinted from Cell, 185, Yang, E., Zwart, M.F., James, B., Rubinov, M., Wei, Z., Narayan, S., Vladimirov, N., Mensh, B.D., Fitzgerald, J.E., Ahrens, M.B., A brainstem integrator for self-location memory and positional homeostasis in zebrafish, 50115027.e205011-5027.e20, Copyright (2022) with permission from Elsevier. Full text @ Cell