
FIGURE 1
- ID
- ZDB-FIG-230520-6
- Publication
- Blombery et al., 2023 - Biallelic deleterious germline SH2B3 variants cause a novel syndrome of myeloproliferation and multi-organ autoimmunity
- Other Figures
- All Figure Page
- Back to All Figure Page
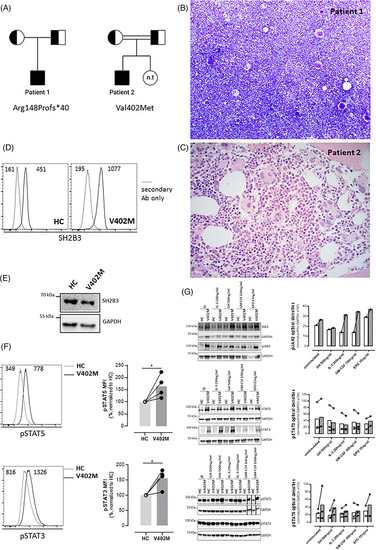
Clinicopathological features of patients with biallelic loss of function variants in SH2B3. (A) Pedigree for patients 1 and 2; half‐filled squares and circles indicate carrier status for SH2B3 variants for males and females, respectively. Fully filled squares indicate homozygous SH2B3. n.t. – not tested. Double line indicates consanguinity. (B) Bone marrow aspirate from patient 1 demonstrating hypercellular marrow with megakaryocytic hyperplasia and morphological atypia (×100). (C) Bone marrow trephine biopsy from patient 2 demonstrated megakaryocytic hyperplasia and atypia (haematoxylin and eosin (H&E), ×400). (D) SH2B3 expression assessed intracellularly by flow cytometry on skin‐derived fibroblasts using a mouse anti‐human SH2B3 antibody followed by goat anti‐mouse IgG‐AlexaFluor488 staining after fixation and permeabilization using the BD Cytofix/CytoPerm buffers. Immunoreactive SH2B3 expression is present in wildtype healthy control (HC) and proband (V402M) cells. Negative control is secondary antibody (Ab) only. Numbers inside panels represent mean fluorescence intensity (MFI). (E) Western blot showing normal expression of SH2B3 in V402M skin‐derived fibroblasts; GADPH loading control. (F) Basal STAT‐5 and STAT‐3 phosphorylation was evaluated on skin‐derived fibroblasts by Phosflow assay using BD Phosflow Fix I and Perm III buffers according to manufacturer instructions (BD Biosciences). Histograms on the left show a representative example and graphs on the right the normalised mean values for four experiments. Numbers inside histograms represent mean fluorescence intensity (MFI). pSTAT3 and pSTAT5 levels were significantly elevated relative to control in the proband (V402M) samples (*indicates |