
Fig. 3.
- ID
- ZDB-FIG-230508-49
- Publication
- Hammond et al., 2023 - An arginase 2 promoter transgenic illuminates immune cell polarisation in zebrafish
- Other Figures
- All Figure Page
- Back to All Figure Page
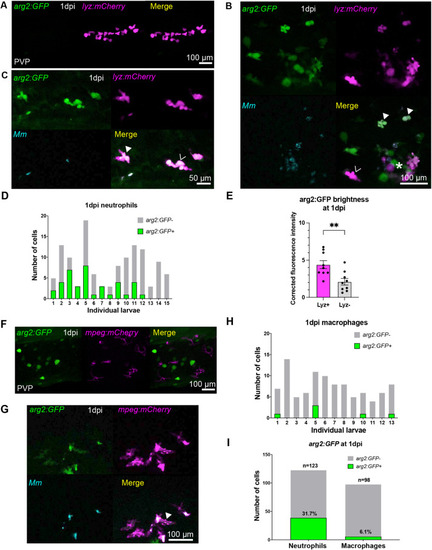
Neutrophils are the predominant immune cell that express arg2:GFP post Mm challenge. (A) Fluorescence confocal micrographs of 1 dpi (2 dpf) embryos (arg2:GFP line crossed to the lyz:mCherry line) after PVP mock infection at 1 dpf. (B) Fluorescence confocal micrographs of 1 dpi (2 dpf) embryos (arg2:GFP line crossed to the lyz:mCherry line) after Mm infection at 1 dpf showing GFP-positive neutrophils (filled arrowheads) and GFP-negative neutrophils (hollow arrowhead) around an area of high infection (asterisk). (C) Fluorescence confocal micrographs of 1 dpi (2 dpf) embryos (arg2:GFP line crossed to the lyz:mCherry line after Mm infection at 1 dpf showing that both infected (filled arrowhead) and non-infected (hollow arrowhead) neutrophils can express arg2:GFP. n=15 larvae imaged over three independent experiments. (D) Graph showing the number of arg2:GFP-positive and -negative neutrophils in a 40× region of interest in the caudal vein region that contained Mm bacteria, post infection, in individual larvae. Data shown are from n=15 larvae accumulated from three independent experiments. (E) Corrected fluorescence intensity of arg2:GFP expression in lyz:mCherry-positive neutrophils compared to that of cells with an immune morphology that were lyz:mCherry negative at 1 dpi (2 dpf). Data shown are from n=9 larvae accumulated from three independent experiments. P-values were calculated using unpaired two-tailed t-test. **P<0.01. (F) Fluorescence confocal micrographs of 1 dpi (2 dpf) embryos (arg2:GFP line crossed to the mpeg:mCherry line) after PVP control injection at 1 dpf. (G) Fluorescence confocal micrographs of 1 dpi (2 dpf) embryos (arg2:GFP line crossed to mpeg:mCherry line) after Mm infection at 1 dpf showing a single GFP-positive macrophage (filled arrowhead) in this field of view (representing one of six instances observed). (H) Graph showing the number of arg2:GFP-positive and -negative macrophages in a 40× region of interest in the caudal vein region that contained Mm bacteria post infection in individual larvae. (I) Graph showing the percentage of arg2:GFP-positive and -negative neutrophils and macrophages in a 40× region of interest around the infected caudal vein region. Data shown are from n=98-123 cells accumulated from 15 larvae for neutrophils and 13 larvae for macrophages over three independent experiments. |