
FIGURE
Figure 3
- ID
- ZDB-FIG-230416-91
- Publication
- Rolland et al., 2023 - Prolonged Piezo1 Activation Induces Cardiac Arrhythmia
- Other Figures
- All Figure Page
- Back to All Figure Page
Figure 3
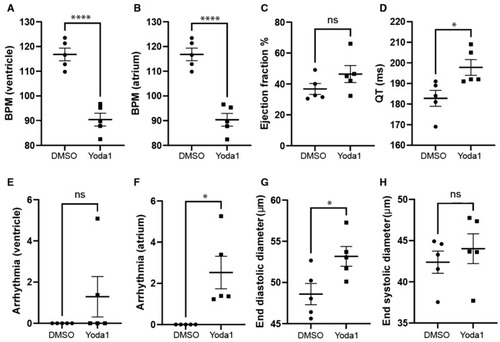
Cardiac physiology of Yoda1-treated larvae. (A) Ventricular rate. (B) Atrial rate. (C) Ejection fraction. (D) QT interval. (E) Ventricular arrhythmia. (F) Atrial arrhythmia (G) End diastolic diameter. (H) Ventricle maximum fractional length. n = 5. Statistical significance was assessed by independent t-test and Bonferroni correction. *: p-value < 0.05, ****: p-value < 0.0001. |
Expression Data
Expression Detail
Antibody Labeling
Phenotype Data
Phenotype Detail
Acknowledgments
This image is the copyrighted work of the attributed author or publisher, and
ZFIN has permission only to display this image to its users.
Additional permissions should be obtained from the applicable author or publisher of the image.
Full text @ Int. J. Mol. Sci.