
Fig. 2
- ID
- ZDB-FIG-230328-2
- Publication
- Siregar et al., 2022 - Comparison of the psychoactive activity of four primary Areca nut alkaloids in zebrafish by behavioral approach and molecular docking
- Other Figures
- All Figure Page
- Back to All Figure Page
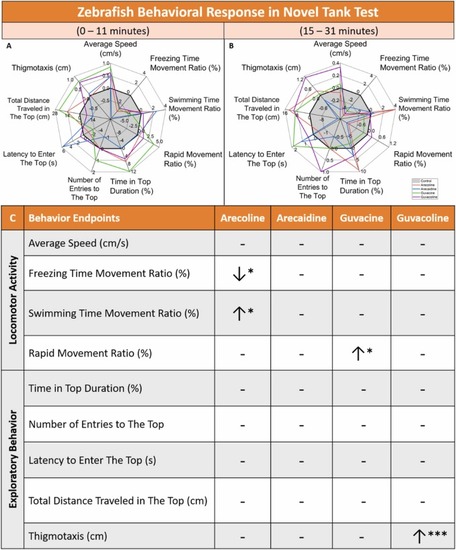
Fig. 2. Profile plots of behavior endpoints of untreated control, arecoline, arecaidine, guvacine, and guvacoline exposed zebrafish from novel tank test (A) before and (B) after 11 min exposure to the novel environment. The plots are expressed as the differences in the median of every treated group to the control group. (C) Summary table of behavioral differences between untreated and treated zebrafish groups. The upward arrow (↑) and downward arrow (↓) represent a statistically significant increase and decrease in the value of comparison between untreated and treated zebrafish groups, respectively. The data from all timepoints were put together and analyzed by the Two-Way ANOVA test with the Geisser-Greenhouse correction (n = 30 for the control, Arecaidine, Guvacine, and Guvacoline treatment groups; n = 27 for Arecoline treatment groups, * P < 0.05, *** P < 0.001). |