
Fig. 4
- ID
- ZDB-FIG-230318-22
- Publication
- Wu et al., 2021 - A sensitive GRAB sensor for detecting extracellular ATP in vitro and in vivo
- Other Figures
- All Figure Page
- Back to All Figure Page
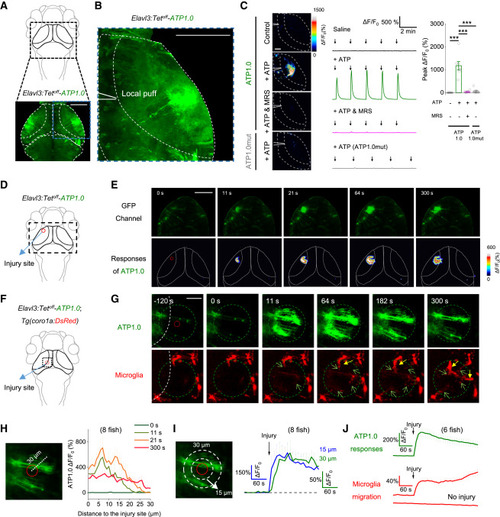
Figure 4. GRABATP1.0 reveals in vivo ATP release induced by injury in a zebrafish model (A and B) Schematic diagram depicting in vivo confocal imaging of fluorescence changes induced by a localized puff (via a micropipette; see inset) of various compounds in the optic tectum of zebrafish larvae expressing ATP1.0 (Elavl3:Tetoff-ATP1.0) or ATP1.0mut (Elavl3:Tetoff-ATP1.0mut). (C) Representative fluorescence images (left), traces (middle), and summary (right) showing the response of ATP1.0 or ATP1.0mut to the indicated compounds. Arrows indicate the localized application of saline (Control) or ATP (5 mM). Where indicated, MRS-2500 (90 μM) was applied; n = 6 or 7 fishes. (D) Schematic diagram depicting confocal imaging of ATP1.0 responses before and after two-photon laser ablation (i.e., injury) in the optic tectum of zebrafish larvae expressing ATP1.0. The red dashed circle indicates the region of laser ablation, and the black dashed rectangle indicates the imaging region shown in (E). (E) Time-lapse pseudocolor images showing the response of ATP1.0 to laser ablation in the optic tectum. The laser ablation was performed at time 0 s and lasted for 7 s, and the ATP1.0 fluorescence was imaged beginning 2 min before laser ablation. (F) Schematic diagram showing dual-color confocal imaging of ATP release and microglial migration before and after laser ablation in transgenic zebrafish Tg(coro1a:DsRed) larvae expressing ATP1.0. In Tg(coro1a:DsRed) larvae, the microglia express DsRed. The red dashed circle indicates the region of laser ablation, and the black dashed rectangle indicates imaging region. (G) In vivo time-lapse confocal images showing the migration of microglia (red) and the change in ATP1.0 fluorescence (green) before and after laser ablation (start at time 0 s). The green dashed circle indicates the boundary of the ATP wave at 300 s, and the signal measured in the green dashed circle was used for the analysis in (J). Green arrows indicate the protrusions of microglia entering the green dashed circle; solid yellow arrows indicate the cell bodies of microglia entering the green dashed circle. (H) Summary of the ATP1.0 response in different distances to the injury site, measured at 0, 11, 21, and 300 s after injury. (I) Time course of the ATP1.0 response measured at 15 and 30 μm from the site of laser ablation. The arrow shown in traces indicates the beginning of the 7 s laser ablation. (J) Time course of the ATP1.0 response (green) and the microglia migration (red) before and after laser ablation (vertical arrow); also shown is a trace of DsRed fluorescence measured in the area without laser ablation of the same larvae. ROIs 60 μm in diameter are used for analysis. Scale bars represent 40 μm (B) and (C), 100 μm (E), and 30 μm (G). Data shown in (C) and (J) are presented as mean ± SEM; data shown in (H) and (I) are presented as mean + SEM; numbers in parentheses in (H)–(J) represent the number of zebrafish larvae in each group. The data in (C) were analyzed using Student’s t test; ∗∗∗p < 0.001. See also Figures S4 and S7 and Video S1. |